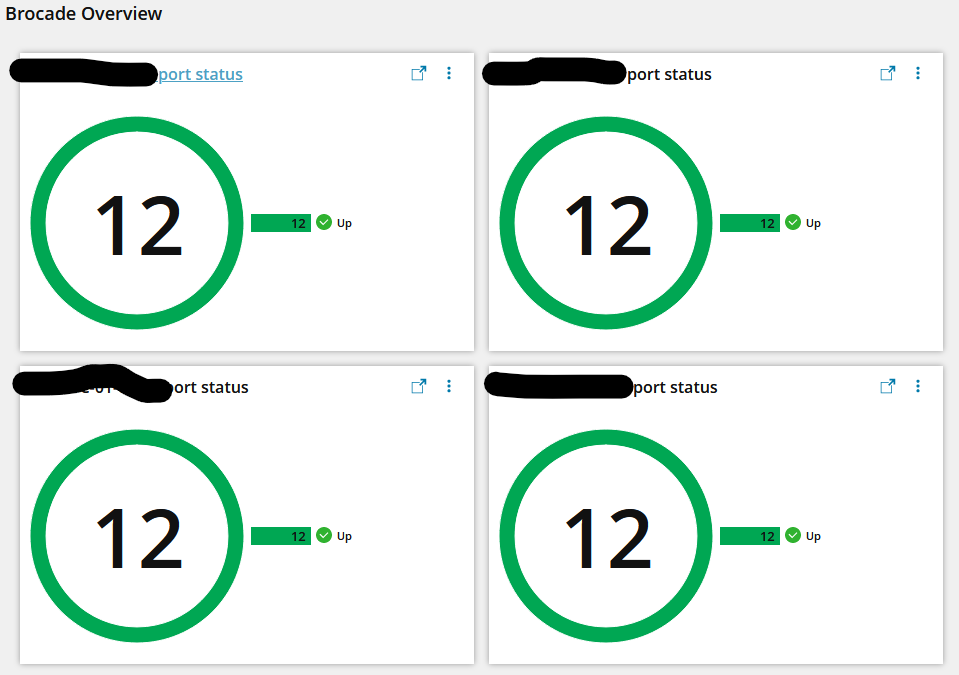
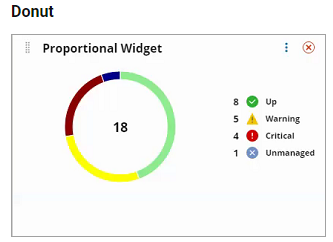
I'm trying to create a widget like step 2 on https://documentation.solarwinds.com/en/success_center/orionplatform/content/core-fusion-proportional-widgets.htm for the ports on our Brocade switches.
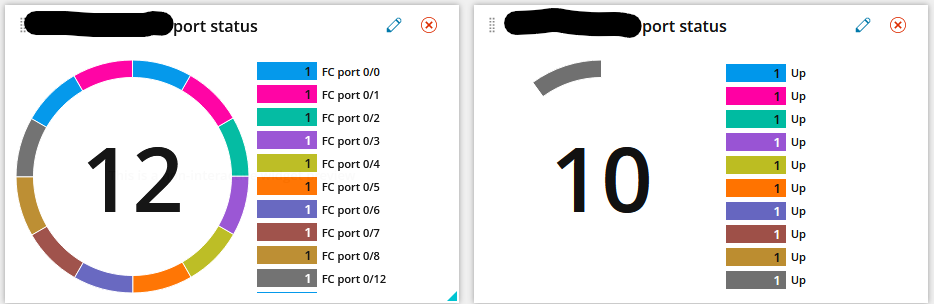
When I used the graphical query builder it was limiting the output to the top 10 for some reason & I couldn't figure out how to turn it off. So I went into the hand editor & deleted that part, which moved me from the right result to the left result, so I have all the ports at least.
In addition to that, it's not grouping by status, the best I can get is just a list of port descriptions with a 1 by them.
I think I want to use a modified version of the code example from here: https://documentation.solarwinds.com/en/success_center/orionplatform/content/core-fusion-swql-data-model-examples.htm
SELECT COUNT(1) as value, Status,
	CASE WHEN Status = 1 THEN 'status_up' WHEN Status =14 THEN 'status_down' WHEN Status =3 THEN 'status_warning' ELSE 'status_unknown' END as icon,
       CASE WHEN Status = 1 THEN 'green' WHEN Status =14 THEN 'red' WHEN Status = 3 THEN 'yellow' ELSE 'gray'
END as color
FROM Orion.Nodes GROUP BY status ORDER BY value DESC
This is what I have working on the left graph:
SELECT InterfaceTypeDescription,n.InterfaceName,n.FullName,n.StatusDescription,n.Status
FROM Orion.NPM.Interfaces n

WHERE (InterfaceTypeDescription LIKE '%Fibre%' AND FullName LIKE '%[switch name]%')
It seems like I should be able to combine these 2 code snippits to get what I want, but I don't know enough about SWQL to get them integrated.
Thanks!
-Chaz