User here with lots of experience putting data in to SolarWinds and no experience taking data out of SolarWinds. So, I asked SolarWinds support this question and they sent me here. Please indulge. Or ignore. Your choice.
I am trying to set up a Modern Dashboard to monitor power equipment (mostly PDUs and UPSs) for one of the data rooms in one of my employer's sites, with the goal of expanding to all data rooms at this site, and then to all sites.
To start, I want to set up a chart showing the polled power consumption in kilowatts for the week for each PDU.
According to what I've googled, it should be easy to do this with Timeseries Widgets linked to PerfStack Analysis Projects linked to Universal Device Pollers. (If I'm wrong about that, please let me know).
I have a UnDP transform that is collecting the data I want to chart for the nodes I am interested in. We’ll look at RACK3-PDU1 as the example:
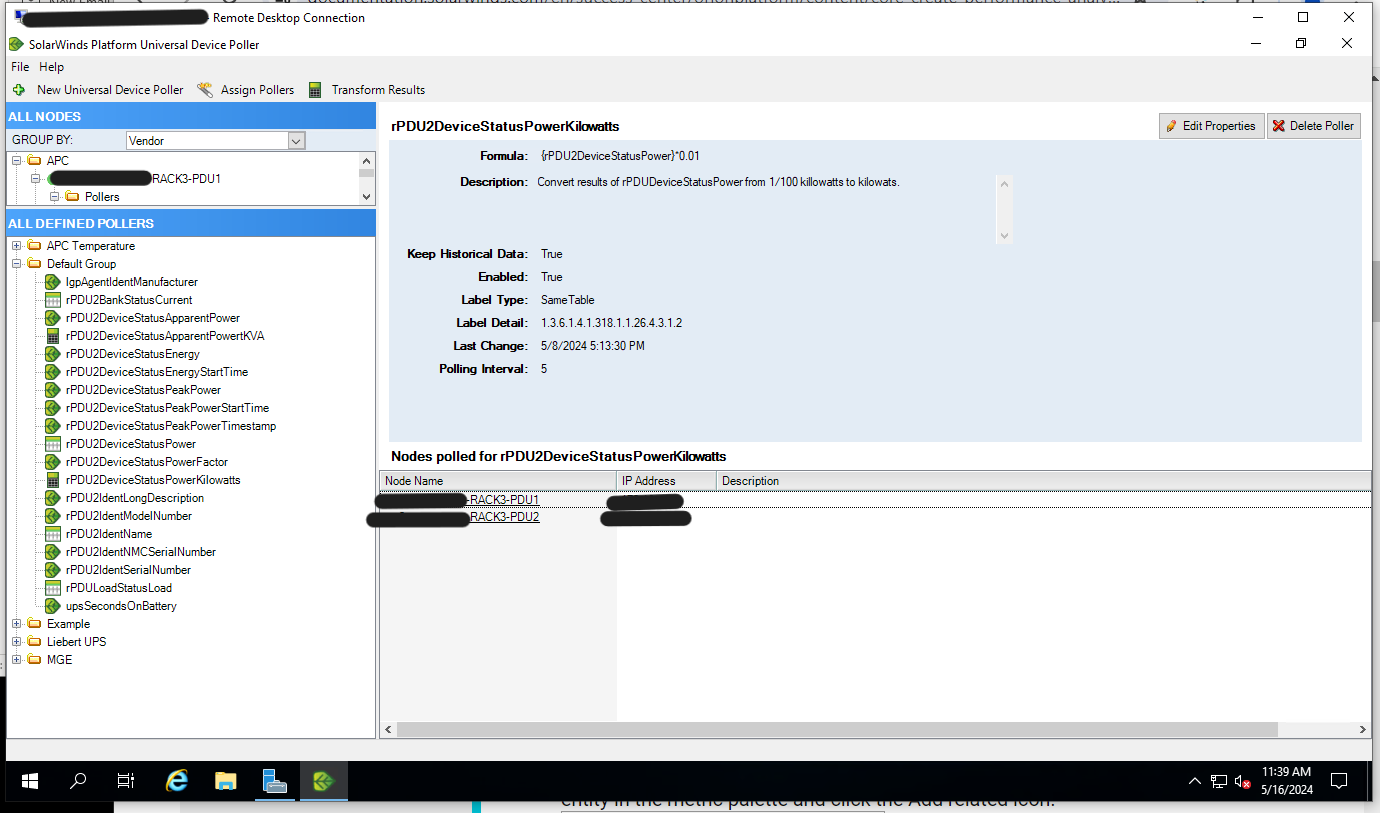
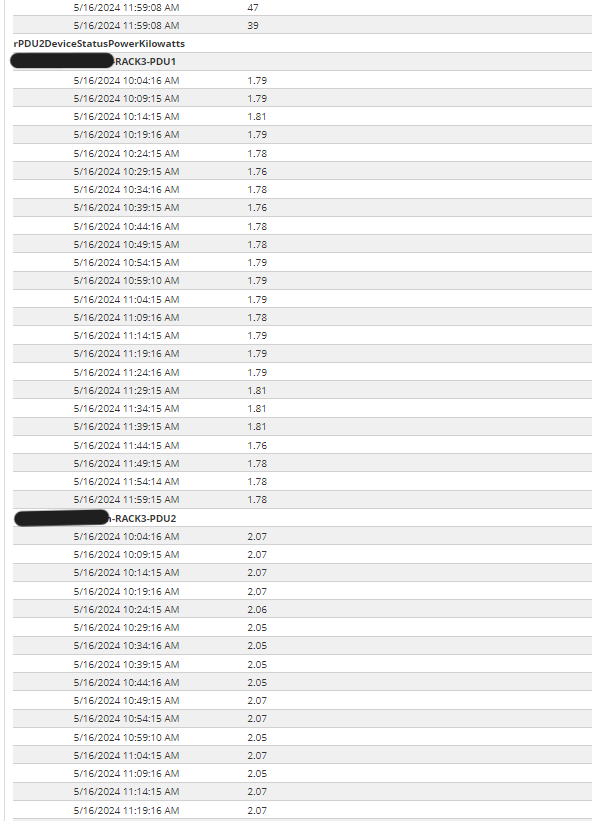
This transform is working and has historical data in it for the node in question, and this data can be accessed as a table in a report:
However, when creating a new PerfStack Analysis Project, this transform does not appear in the Metric Palette list for RACK3-PDU1, even though it is in the Default Group, which does appear in the Palette:
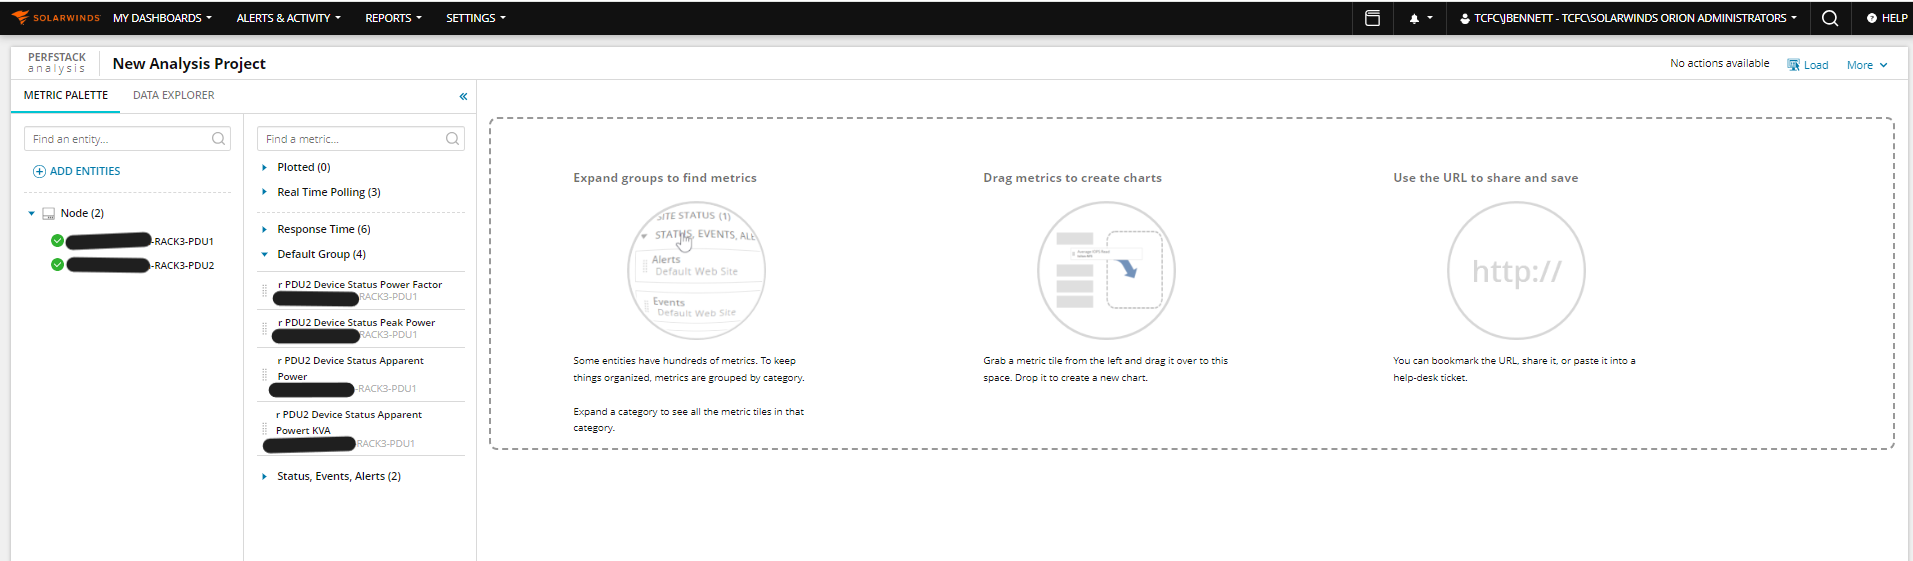
In fact, only four of the 16 UnDPs that are in the Default Group and are assigned to RACK3-PDU1 appear in the Metric Palette:
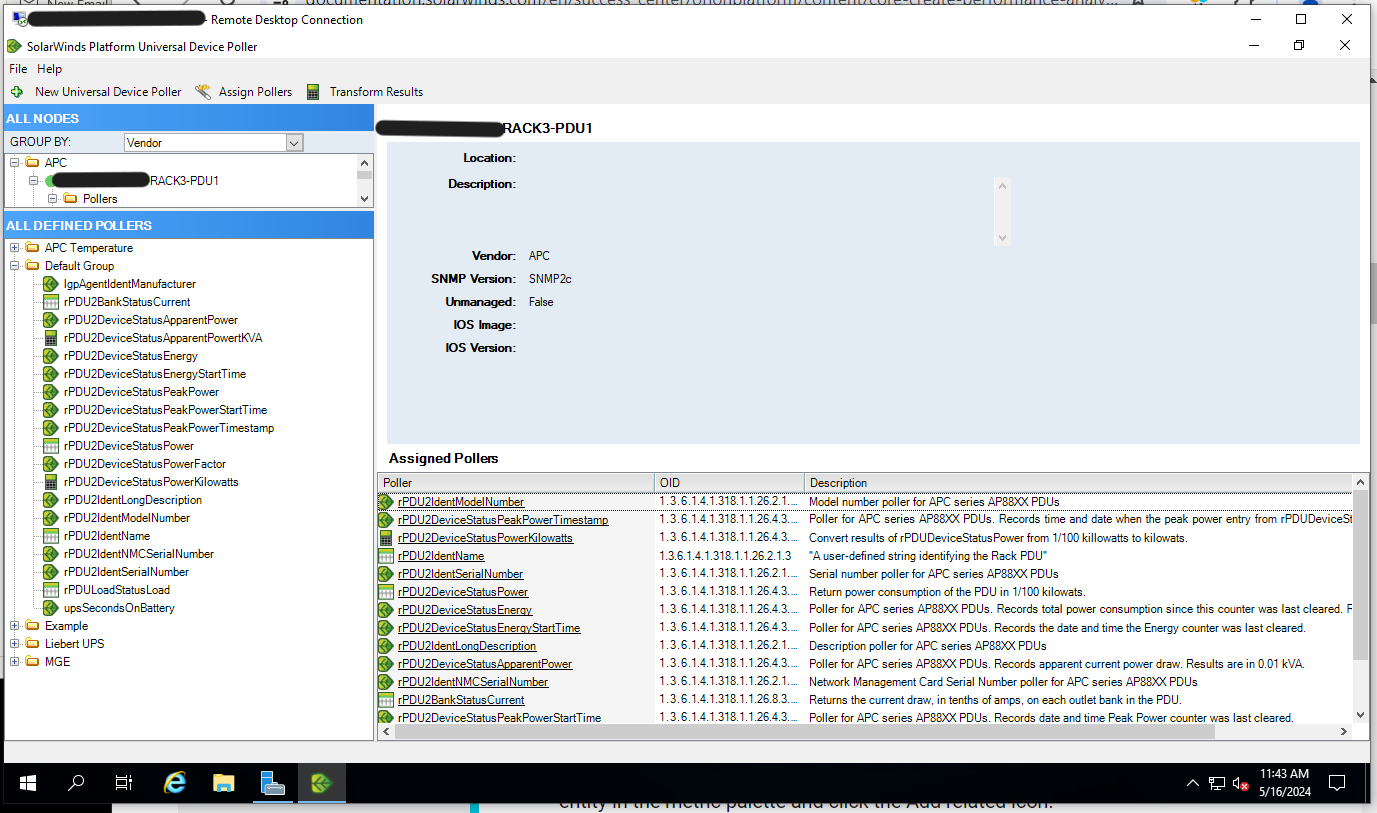
Any ideas as to why this might be the case? I can’t find any obvious differences between the UnDPs that appear and the ones that don’t.
Is there a way to select a UnDP data source as a metric without it appearing in the Metric Palette?
Thank you for your help!
