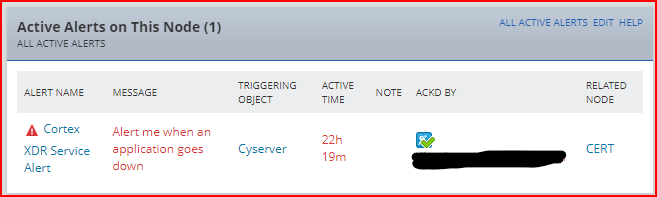
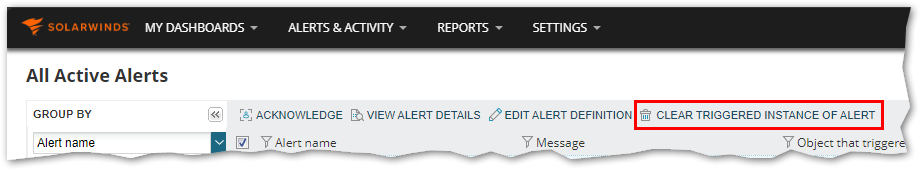
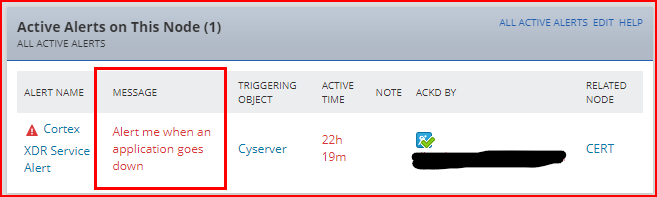
Within the last week I created a new I created anew application monitor to monitor a service that's deployed across my companies "server verse". After linking the component monitor to a alert, I got an influx of servers reporting this service was down. This was expected behavior as I suspected there were a few machine that were out of compliance. While working through the alerts I noticed some of the alerts were reporting the monitored service was down but it was in fact up on the node itself. this is obviously a problem because I need to trust this alert. There are also nodes reporting that the service itself is in fact up and running?
Troubleshooting steps:
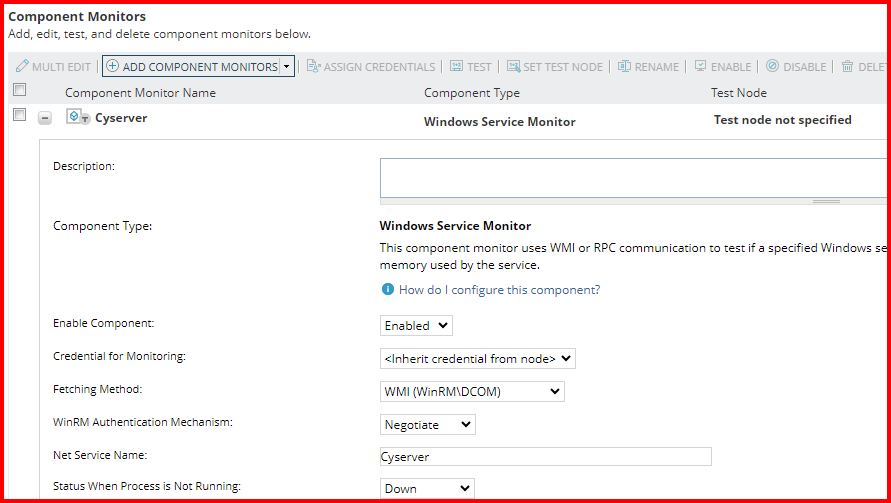
1. I verified the application template was pointing to the correct service.
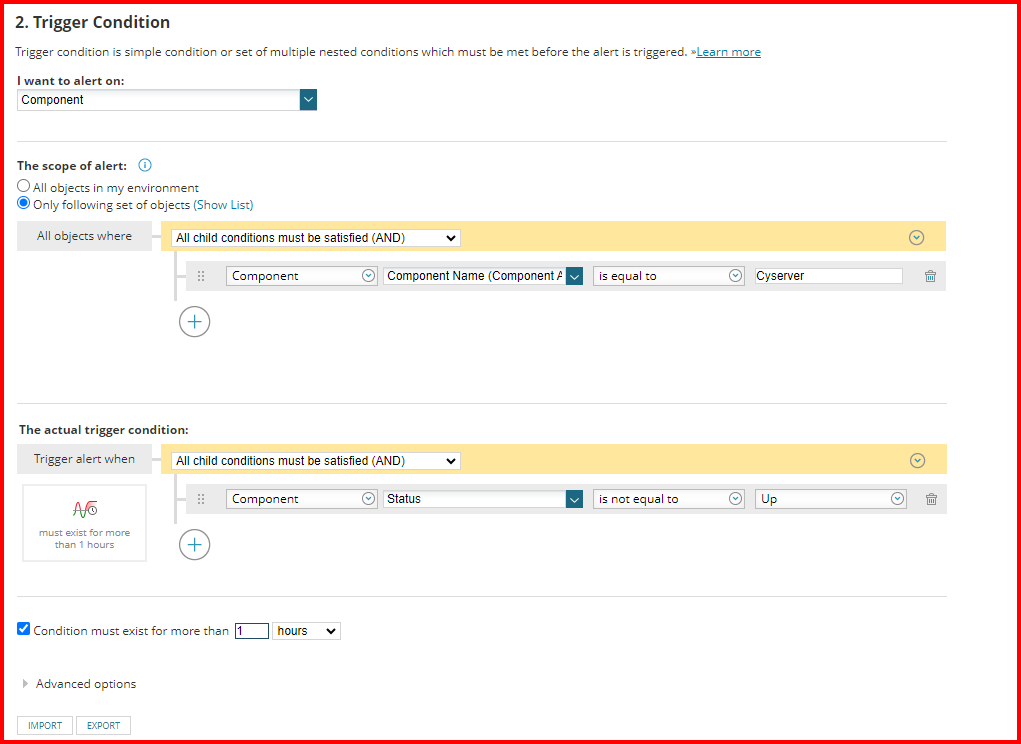
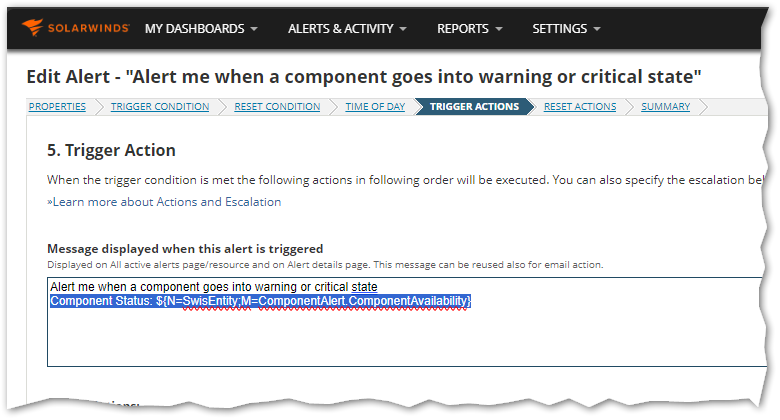
2. Confirmed the alert logic was correct.
3. Re-polled the node
3. Restarted the service on the affected node.
Is this a known bug? If so why is only affecting a few nodes.
How can I get this application monitor to poll more accurately?