Hello,
I have a custom query that folks on here helped me set up years ago. Today I was creating a new dashboard. I added the existing SWQL code to the custom query widget and was suprirsed when I only had 6 nodes listed, while the OOB Down Nodes widget was showing 50+. Any idea why this is occurring? I have a view limitation to a group that includes specific nodes.
SELECT
NodeName AS [Node Name],
'/Orion/images/StatusIcons/Small-' + StatusIcon AS [_IconFor_Node Name],
DetailsUrl AS [_LinkFor_Node Name],Nodes.CustomProperties.Alert_Team AS [Alert Team], Nodes.CustomProperties.Business_Function AS [Business Function],
MAX(ToLocal(DOWNEVENT.EVENTTIME)) AS [Down Time]
FROM ORION.NODES NODES
INNER JOIN ORION.EVENTS DOWNEVENT
ON NODES.NODEID = DOWNEVENT.NETWORKNODE
WHERE STATUS = 2
GROUP BY NodeName, StatusIcon, DetailsUrl, Nodes.CustomProperties.Alert_Team, Nodes.CustomProperties.Business_Function
ORDER BY NodeName
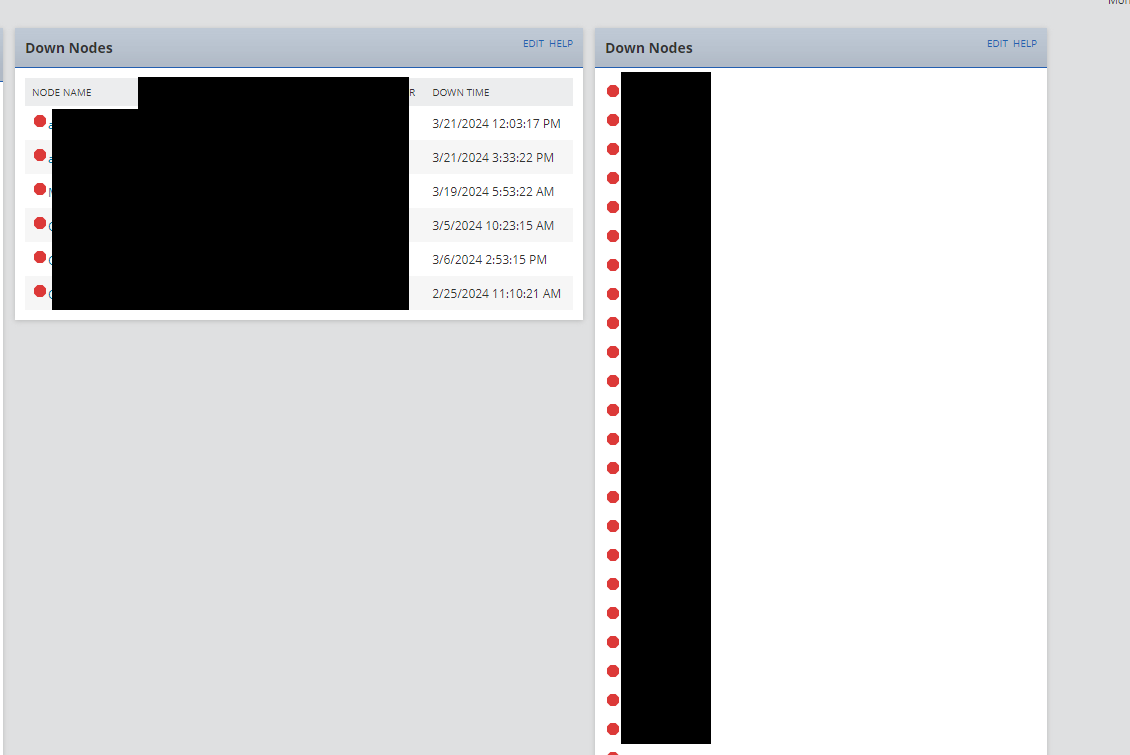
This is what I'm seeing on the dashboard.