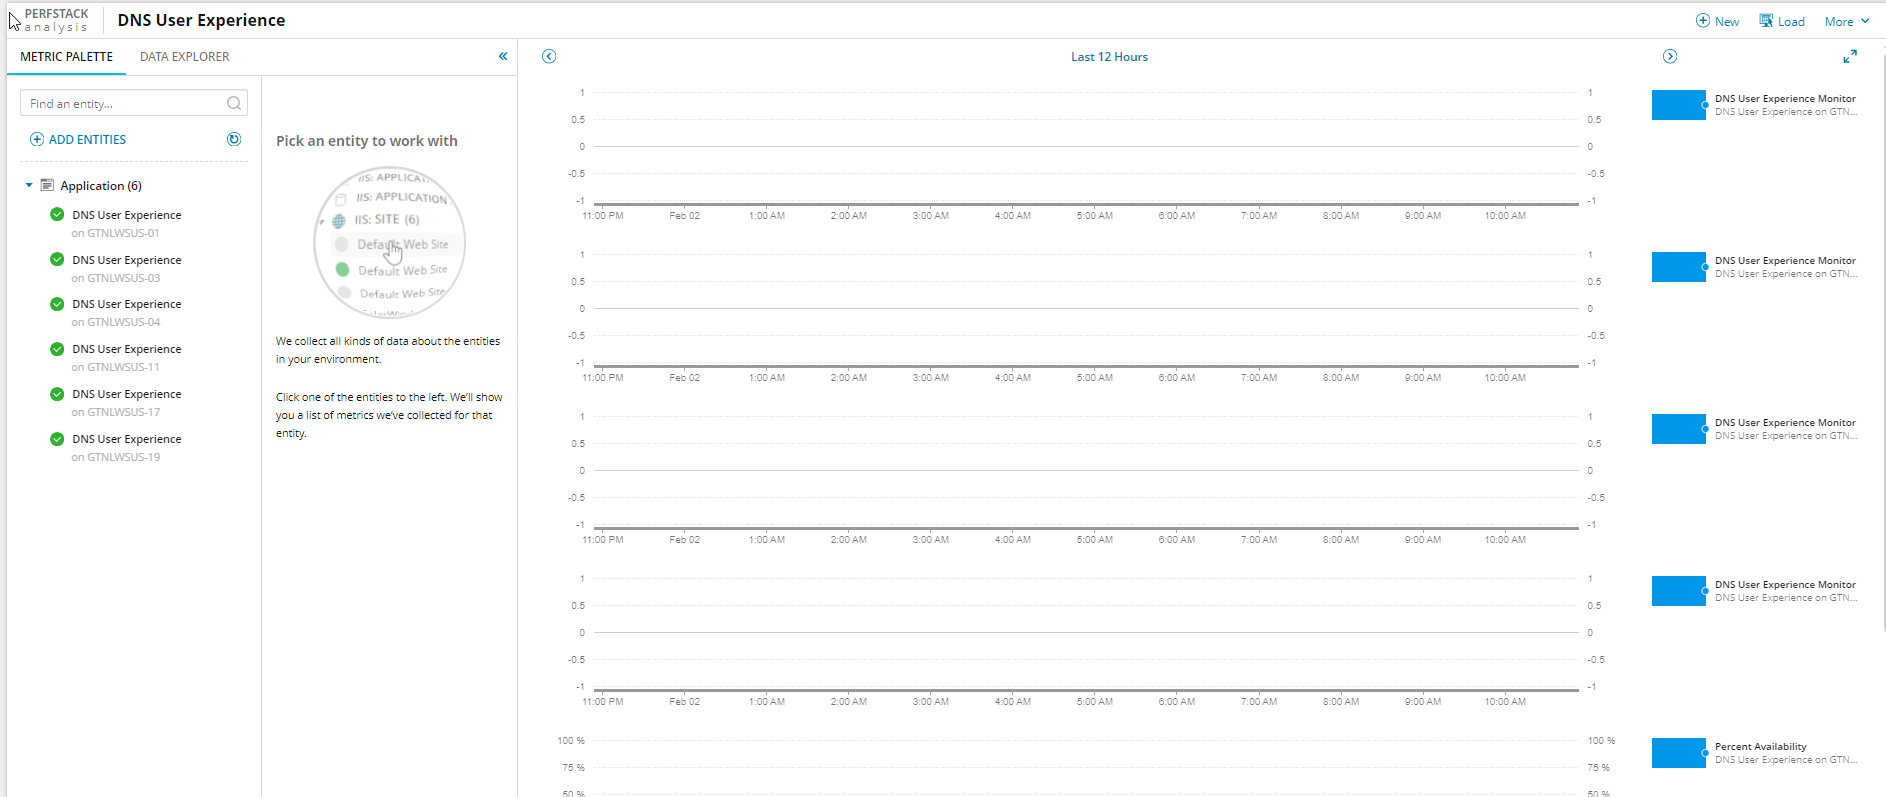
I try to create a PerfStack DNS USer Experience Chart, but don't get any data.When drilling down I do see there is data.ThanksBart Nieboer
So, it looks like my first and sometimes obvious questions are answered. It also looks like you tried all of them in your chart with the same results.
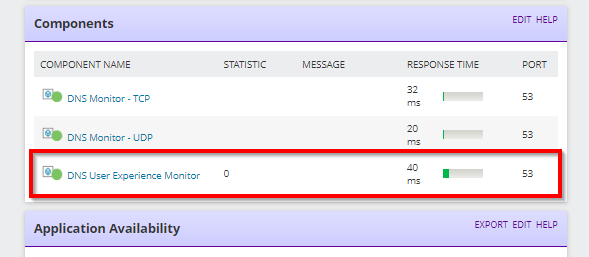
However, I'm noticing the "Statistic 0" value in your component monitor and wonder if that is the issue. Take a look at this thread. Granted, it's for a script, but I'm wondering about the configurations of the component monitors themselves. I could be barking up the wrong tree, as the old saying goes, but that Statistic value of 0 is sticking in my head.
Also, here is a basic troubleshooting article for PerStack in case you haven't seen it. Some of this you've already verified but there are some other points you may not have considered.
If it's not the statistic threshold, let me know, and we'll see if we can find another reason.
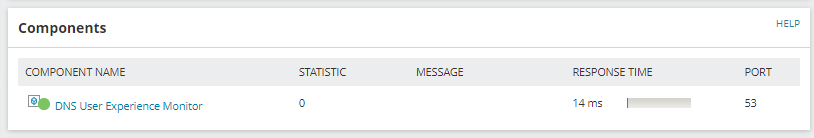
I wasn't able to get 'Statistic Value' when trying to graph this. I used 'Response Time' instead and was able to get the MS it took for the reply.
I don't really know the answer to your question, What I did is to compare what you see on the Demo Site, Looks to be identical.hco.demo.solarwinds.com/.../ApplicationDetails.aspx