Hi,
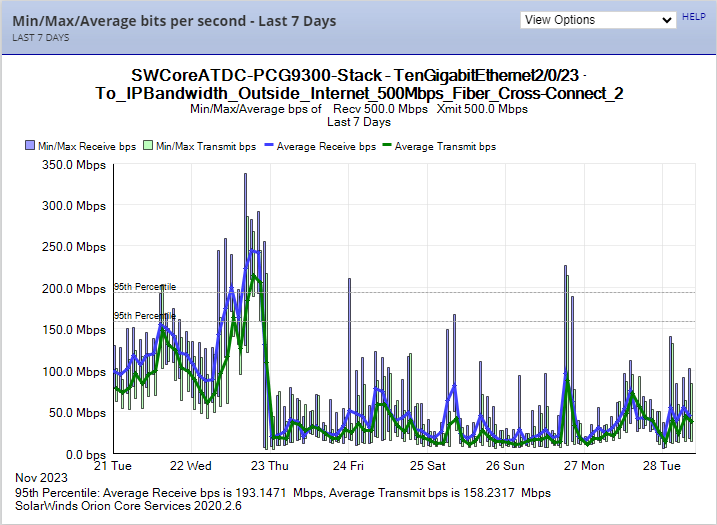
I have the following widget on my interface level view, and that shows me the most important information I need; Namely, max bandwidth utilization of an interface. However, it only shows me 7 days worth.
If I click the View Options drop down I can expand that to 30 days or longer via custom policy. But when doing that it takes me to the Perfstack, and there does not appear to be a maximum bandwidth metric from the selectable Interface Traffic metrics. There is average, and there is min, but no max.
This seems crazy to me, as both of those metrics are relatively useless if you can't see a historical graph of max bandwidth utilization. Am I missing something?