How to add memory utilization and CLI in top 10 process alert
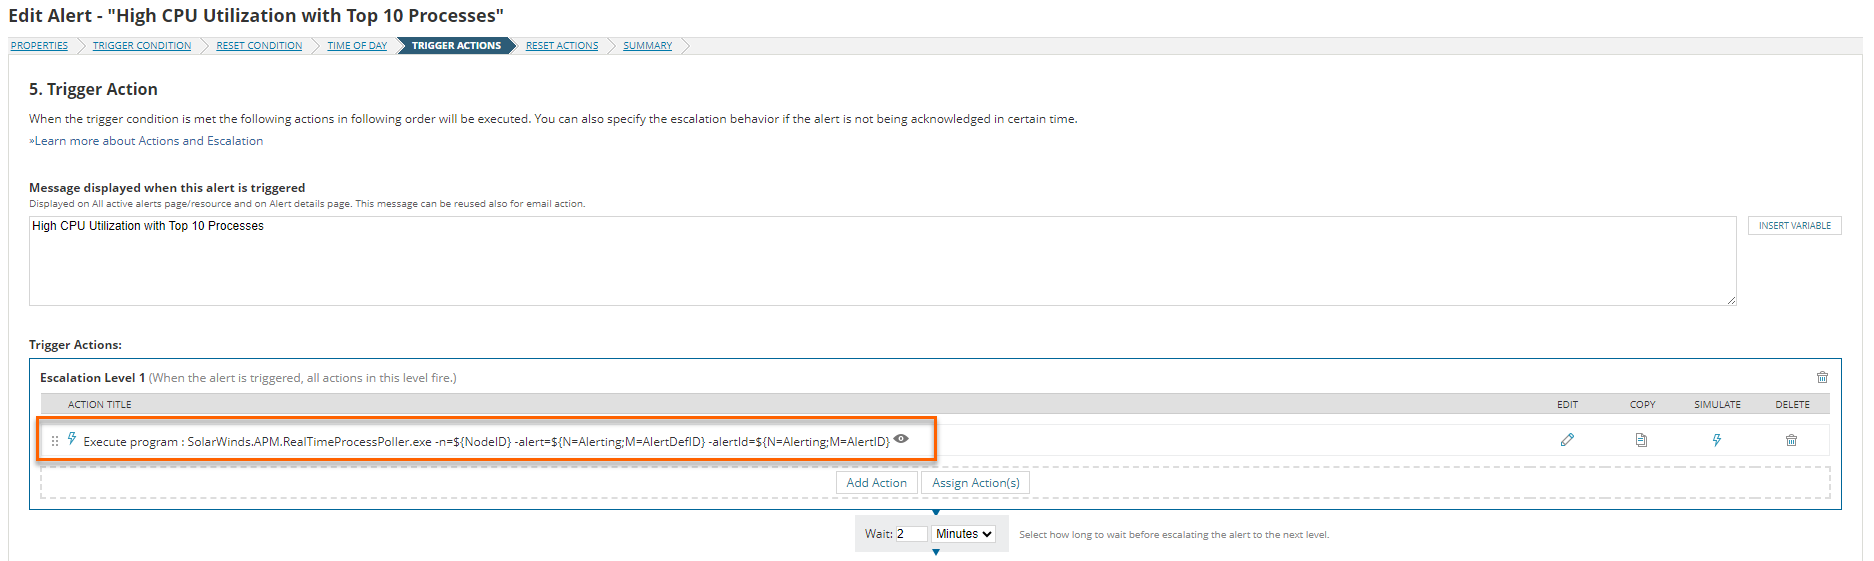
If we start with the alert action, it shows the following:
For the alert that displays the top 10 processes, it uses the SolarWinds.APM.RealTimeProcessPoller.exe executable on your SolarWinds server.
SolarWinds.APM.RealTimeProcessPoller.exe
If you navigate to the server and get help (/?) on the program from the CLI, it provides the following:
/?
SolarWinds.APM.RealTimeProcessPoller.exe -n= [-count=] [-sort=] [-timeout=] [-alertid=]Command line arguments:-n - defines ID of a Node (NodeID), which will be polled-count - defines number of processes to show-sort - defines criteria to use for selection of top processes. Possible values: CPU - processor time. This is default value if command line argument is not specified PhysicalMemory - process physical memory VirtualMemory - process virtual memory DiskIO - process disk I/O per second-timeout - defines timeout for polling in seconds-alertid - defines AlertID of associated triggered alert. If this argument is provided, then alert notes are updated with results from polling-activeObject - defines ActiveObject property of associated triggered alert. If this argument is not provided, NodeID is usedExample: SolarWinds.APM.RealTimeProcessPoller.exe -n=123 -count=20 -sort=VirtualMemory -timeout=300Example usage from 'Execute an External Program' alert action: SolarWinds.APM.RealTimeProcessPoller.exe -n=${NodeID} -alertid=${N=Alerting;M=AlertID}Example usage from 'Execute an External Program' alert action - for alert defined for 'Volume' object type: SolarWinds.APM.RealTimeProcessPoller.exe -n=${NodeID} -alertid=${N=Alerting;M=AlertID} -activeObject=${NetObjectID} -sort=VirtualMemory
If we go back to the execution of the action, you can see it uses the syntax (converted to multiple lines for reasability):
SolarWinds.APM.RealTimeProcessPoller.exe
   -n=${NodeID}
   -alert=${N=Alerting;M=AlertDefID}
   -alertId=${N=Alerting;M=AlertID}
Running it with just a node number (-n=1), returns the process list sorted by CPU. (the default)
-n=1
System information: Processor count: 4 Total Physical Memory: 13,931,436 kB Total Virtual Memory: 31,234,988 kB Total Process Count: 201Name Process ID CPUWmiPrvSE.exe 18060 21.35 %lsass.exe 800 4.18 %conhost.exe 15468 2.66 %svchost.exe 2664 1.9 %MsMpEng.exe 2256 1.29 %SWJobEngineWorker2x64.exe 10616 0.99 %erl.exe 4420 0.68 %SWJobEngineSvc2.exe 4796 0.68 %svchost.exe 468 0.61 %SolarWinds.InformationService.ServiceV3.exe 5728 0.53 %
It can also be sorted other ways by adding in the -sort parameter. Below, I run it with -sort=PhysicalMemory.
-sort
-sort=PhysicalMemory
System information: Processor count: 4 Total Physical Memory: 14,246,828 kB Total Virtual Memory: 31,550,380 kB Total Process Count: 204Name Process ID Physical Memoryw3wp.exe 3968 1,121,204 kBSolarWinds.BusinessLayerHost.exe 3316 974,988 kBSolarWinds.InformationService.ServiceV3.exe 5728 686,744 kBSolarWinds.Collector.Service.exe 2960 620,740 kBSolarWinds.ServiceHost.Process.exe 2236 316,732 kBMsMpEng.exe 2256 315,396 kBSolarWinds.Administration.exe 2880 303,608 kBSolarWinds.BusinessLayerHost.exe 10388 299,468 kBSWJobEngineWorker2x64.exe 10616 237,004 kBNetFlowService.exe 14796 210,284 kB
It can also be run with DiskIO or VirtualMemory as a sort parameter.
DiskIO
VirtualMemory
The most important part in the Alert Action is to provide an Alert and an AlertID as parameters. Why?
Alert
AlertID
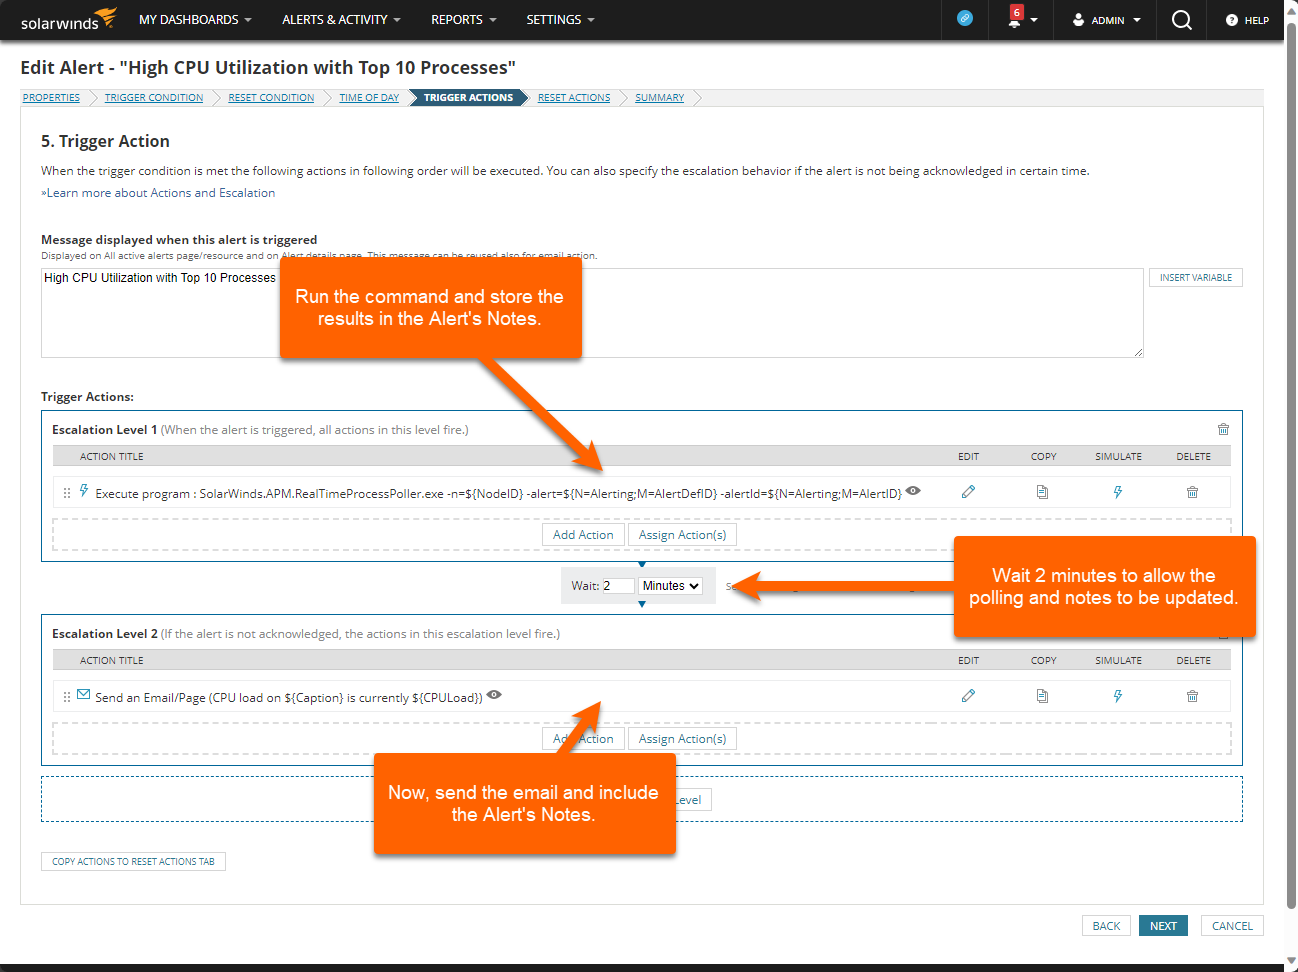
This is alert has escalations:
When the High CPU is detected, it runs the SolarWinds.APM.RealTimeProcessPoller.exe executable which stores the results in the Alert Notes for that triggered alert (because we included the Alert and AlertID as parameters).
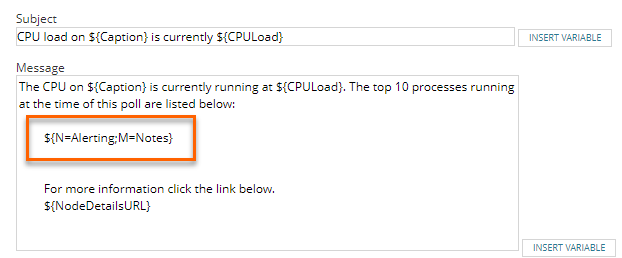
The second escalation (which executes 2 minutes after the first) is what actually sends the email to the parties. One of the variables in that message is the notes, updated in the previous escalation.
You can do the same thing for memory, virtual memory, and disk IO - just be sure to change the language and the alert triggers to match what's being expected.
I presume you are talking about the Top 10 menu item under My Dashboards?
On that basis, then I have found out that this menu/widget is not editable by us, but there are two (that I can see) possible ways to achieve this. The first is to submit a Feature Request over here: The SolarWinds Platform Feature Requests but that is not going to be an immediate help if ever depending on votes, etc...
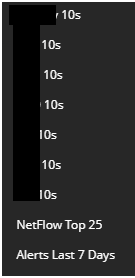
The practical way to do this is to utilise a modern dashboard and if you've never done this then start here: All in on Modern Dashboards written by one of THWACK's MVPs. Our main SolarWinds environment supports multiple clients and one of my first moans about the Top 10 is that I couldn't make it client specific, it was only ever environment wide. Then along came MDs and now I can make as many client specific Top 10's as I like and include the stats I (or more likely, the client) wants to see or have access to.All that is to say to you - go down the road of a modern dashboard and add the link to that to your menus... to give you an idea, our menu now shows direct links to some of our most used MDs: (the blanked out bits are client names)
You can pretty much have the stats you want, for the nodes you want and place them into the current menu system.
Am looking for a different solution. Currently, I have a HIGH CPU alert that will generate along with the top 10 processes with its CPU utilization. Similar to that, I need to generate a memory alert with 10 top processes with its memory utilization.
Then it sounds to me like you already have the start of your solution. Just duplicate and adapt your current CPU alert to do similar for CPU.
Can you share your HIGH CPU alert settings?
Thanks@"KMSigma.SWI" The description you gave was vivid.
Hello @KMSigma.SWI ,
As mentioned above I have configured the alert to capture Physical Memory however, the sort function doesn't seem to list the process by Physical Memory on the email sent by the alert. [It's just blank under the top 10 processes running]
Could you please advise ?
SolarWinds.APM.RealTimeProcessPoller.exe -n=${NodeID} -alert=${N=Alerting;M=AlertDefID} -alertId=${N=Alerting;M=AlertID} -sort=PhysicalMemory
SolarWinds.APM.RealTimeProcessPoller.exe -n=${NodeID} -alert=${N=Alerting;M=AlertDefID} -alertId=${N=Alerting;M=AlertID} -activeObject=${NetObjectID} -sort=PhysicalMemory
@vigneshkce - on the SolarWinds Platform main polling engine, does the SolarWinds.APM.RealTimeProcessPoller.exe return what you'd expect from the command line? If not, then you might need a support case opened.
NVM, it's working as intended. Thank you.By the way, It was a nice article.
Anyway this can be used for swql for a modern dasdhboard - thanks