Hello good people,
I have a question that I've had about Meraki APs node's statis in the NPM for a while.
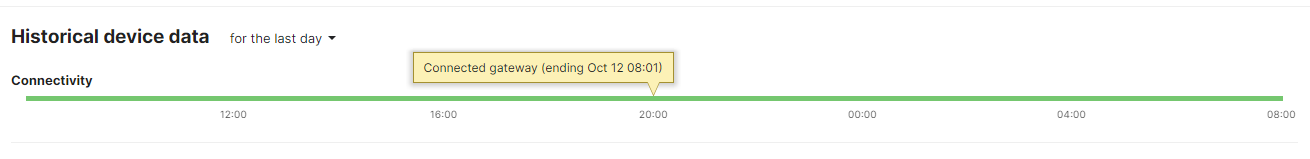
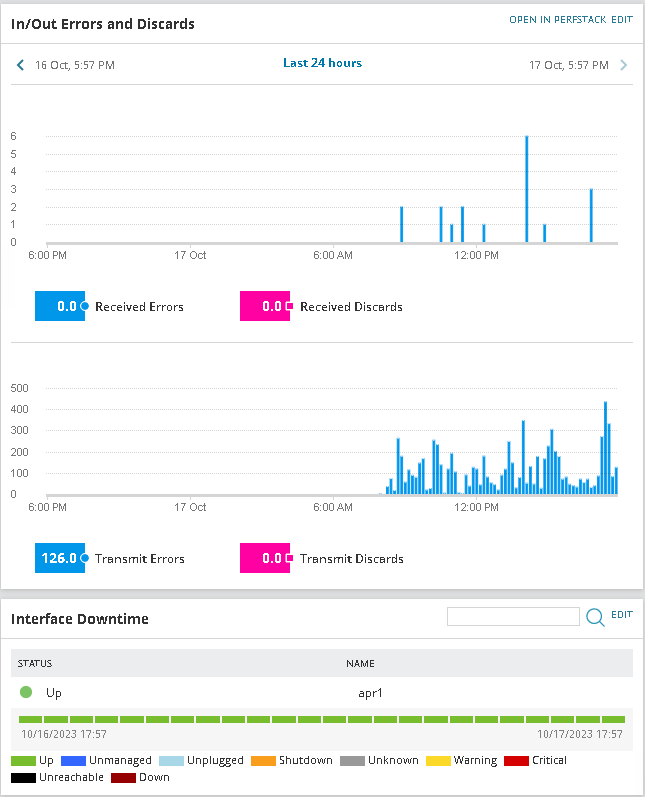
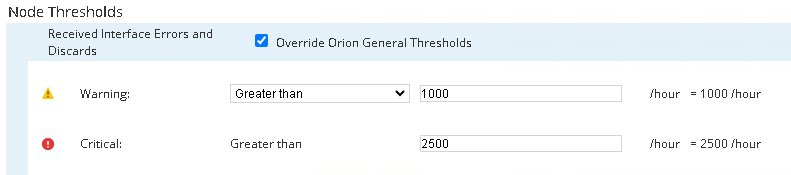
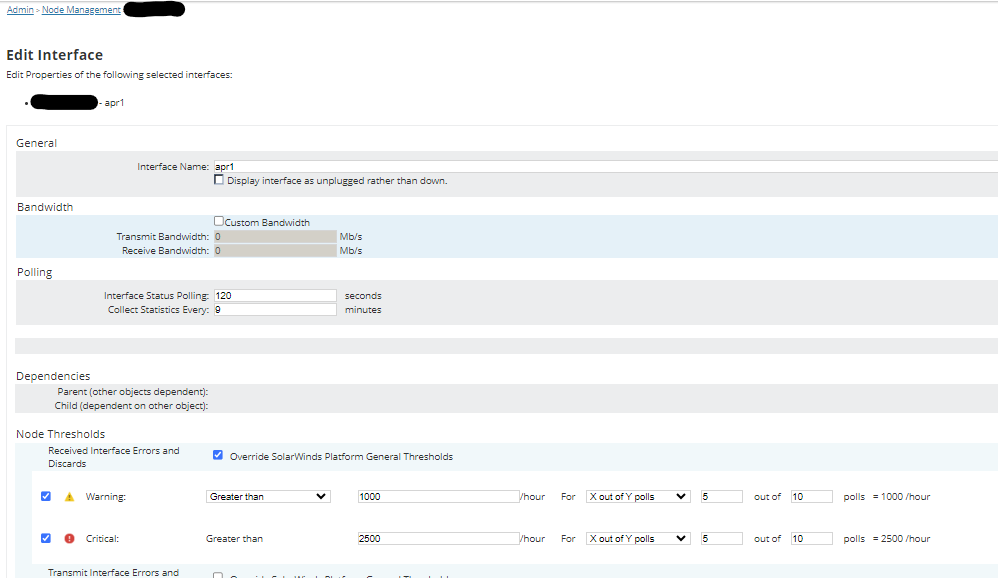
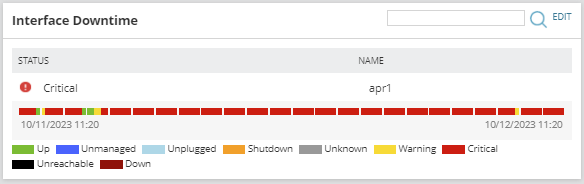
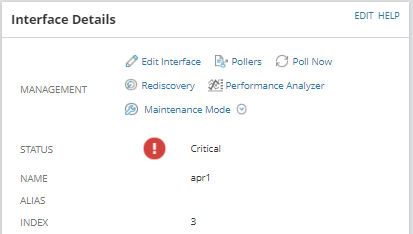
We have many meraki AP node's state that will change to critical when an node's interface state changes to critical. The interface name that's shown in the node's details apr0 and apr1, which I assume is (2.4Ghz and 5.0Ghz networks), only show that the 'interface's downtime' is critical but when I check the Meraki dashboard all is well. Why is that? Where is this status being pulled from? How can I clear this critical state and update the node to show as 'up'?
Thanks in advance for your help all!
Meraki AP status in dashboard: