Occasionally, SNMP will return completely bogus data. I believe it is usually when a monitored device is in the process to restarting, SNMP is available, but internally has not populated the data locations and thus the returned data is essentially random. The biggest problem with this situation is that graphs are useless around this timeframe. Here's an example:
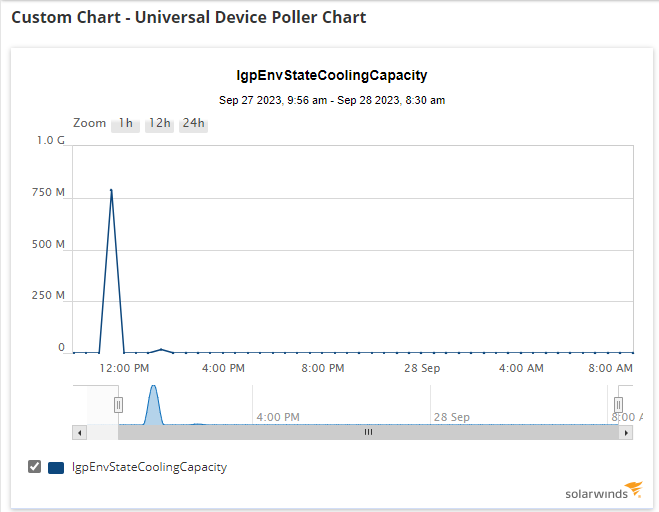
This graph should show how hard an A/C unit is working in a percentage from 0 to 100. During some maintenance, the SNMP capable webcard returned an extraneous reading and thus, the graph is going to be thrown off forever, and will eventually introduce further issues by being averaged to make the entire day look crazy.
What can be done about this? I suppose a SQL script could be written to groom certain data values outside of a specified value range, but that seems tedious and difficuly to maintain. Would a feature request that could do the grooming as the data came in be a better way to handle this? Basically, the Universal Device Poller entry could have a grooming checkbox. If it is checked, a minimum and maximum value can get identified. As the data is gathered in the future, that data can get checked and if it is outside of the specified range, it is simply discarded.
Better ideas?