

When we think about the main features that SolarWinds users get with their Orion platform, capacity planning is not one of the first of the features that come up to mind, however, I personally consider capacity planning one of the best features available in SolarWinds.
SolarWinds Orion comes with out-of-the-box resources to show capacity forecast information. However, these resources don’t cover every single metric that we can benefit from future forecasting. This means that in order to get some nice dashboards or reports with capacity planning data, it is required to create new custom ones.
The Problem
One of the most common capacity planning requirements that I hear from SolarWinds users when we are helping set up their platform is how to know whether or not they have enough switch ports available to connect new devices in remote locations. It is easy to go to the server room to have a look if it is located next door, but what happens when the switch is in a different location and even country time zone?
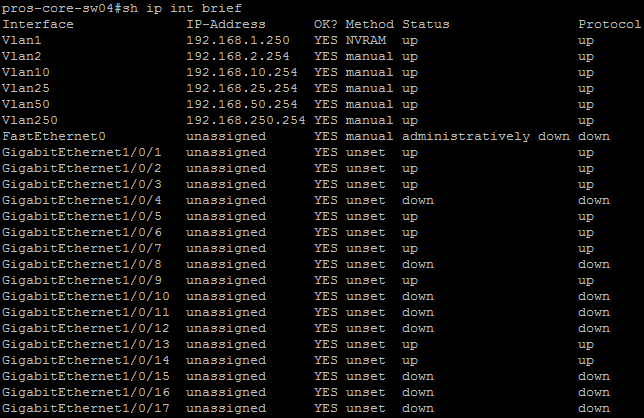
It is possible to log into each switch remotely, execute a ‘show IP interface brief’ command and count mentally how many interfaces are up and how many interfaces are down. But what if, at that point in time, only half of the people have switched on their computer? It could be bank holiday on that location, or there could be people off sick, as this is a point in time reference, as the devices are not built to record historic usage. There are lots of reasons why this is not the way to get an idea of the real number of ports used.
The Solution
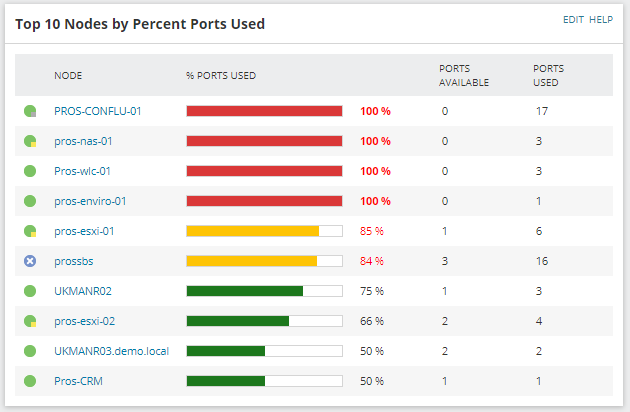
What can SolarWinds do to solve this issue? Port usage data is collected by the SolarWinds Orion User Device Tracker module, which allows you to monitor the port density usage of any device being monitored in the platform and to track who is connected to the network. The former feature not only allows you to get the current status of the ports of the device but also to keep historical data. Analysing the historical data will give you valuable information; such us the maximum number of ports used per switch in the last xx days or months, giving you a better idea of the actual usage and therefore capacity available per switch.
There is no out of the box report or dashboard that would show that information, however, due to the flexibility of Orion we can create a custom report or add a custom table in an existing dashboard to show that.
The Report
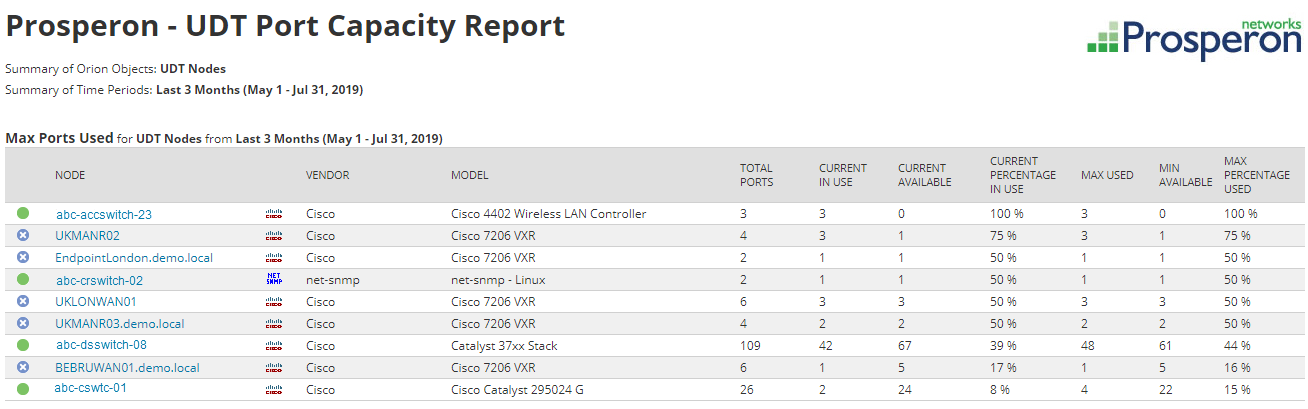
In order to create a report that shows the maximum number of ports used for a specific time period, we can’t use the default filters available using the graphical interface. It is required to use a SQL/SWQL based query instead. This means that some SQL skills and some knowledge of the SolarWinds database schema are required to create this report, but don’t worry, we have it sorted this for you. There is a copy of this report available in this blog that you will be able to import into your platform as long as you have the UDT module installed.
The report output you can see below displays the current capacity and the maximum capacity used for the last three months for all the devices monitored in UDT. Should you want to display other data such as location or any custom property, or want to change the time frame from last 3 months to any other time frame, the SQL report has been configured to make it easy for you to do so.
I hope this article has been informative for you and thank you for your time reading it.
Raul Gonzalez
Prosperon - UK SolarWinds Partners
Installation | Consultancy | Training | Licenses
