
How to Troubleshoot Kubernetes Network Issues

Kubernetes is a container orchestrator that provides a robust, dynamic environment for reliable applications. Maintaining a Kubernetes cluster requires proactive maintenance and monitoring to help prevent and diagnose issues that occur in clusters. While you can expect a typical Kubernetes cluster to be stable most of the time, like all software, issues can occur in production. Fortunately, Kubernetes insulates us against most of these issues with its ability to reschedule workloads, and just replacing nodes when issues occur. When cloud providers have availability zone outages, or are in constrained environments such as bare metal, being able to debug and successfully resolve problems in our nodes is still an important skill to have.
In this article, we will use SolarWinds AppOptics
 tracing to diagnose some latency issues with applications running on Kubernetes. AppOptics is a next-generation application performance monitoring (APM) and infrastructure monitoring solution. We’ll use it’s trace latency on requests to our Kubernetes pods to identify problems in the network stack.
The Kubernetes Networking Stack
Networking in Kubernetes has several components and can be complex for beginners. To be successful in debugging Kubernetes clusters, we need to understand all of the parts.
Pods are the scheduling primitives in Kubernetes. Each pod is composed of multiple containers that can optionally expose ports. However, because pods may share the same host on the same ports, workloads must be scheduled in a way that ensures ports do not conflict with each other on a single machine. To solve this problem, Kubernetes uses a network overlay. In this model, pods get their own virtual IP addresses to allow different pods to listen to the same port on the same machine.
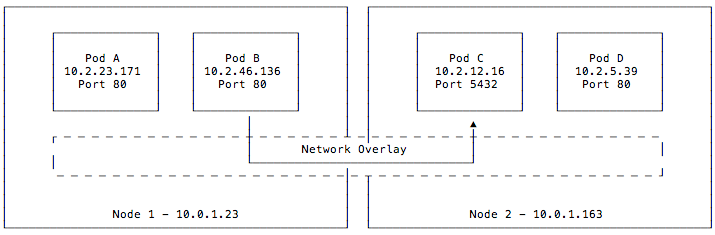
This diagram shows the relationship between pods and network overlays. Here we have two nodes, each running two pods, all connected to each other via a network overlay. The overlay assigned each of these pods an IP and can listen on the same port despite conflicts they (is the “they” referring to the pods or the overlay? If it’s the pods please replace “they” with “pods” and if it’s the overlay, “they” should be changed to “it” would have listening at the host level. Network traffic, shown by the arrow connecting pods B and C, is facilitated by the network overlay and pods do not have knowledge about the host’s networking stack.
Having pods on a virtualized network solves significant issues with providing dynamically scheduled networked workloads. However, these virtual IPs are randomly assigned. This presents a problem for any service or DNS record relying on these pod IPs. Services fixes this by providing a stable virtual IP frontend to these pods. These services maintain a list of backend pods and load balances across them. The kube-proxy component routes requests for these service IPs from anywhere in the cluster.
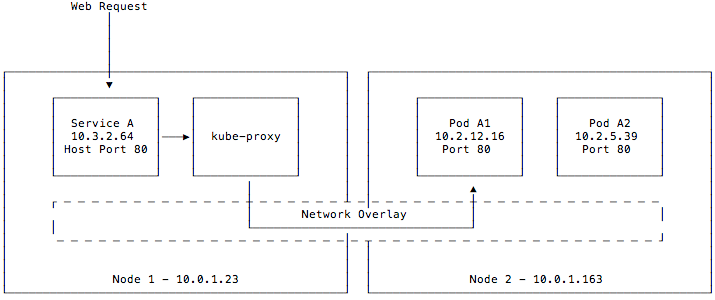
This diagram differs slightly from the last one. Although pods may still be running on node 1, we omitted them from this diagram for clarity. We defined a service A that is exposed on port 80 on our hosts. When a request is made, it is accepted by the kube-proxy component and forwarded onto pod A1 or A2, which then handles the request. Although the service is exposed to the host, it is also given its own service IP on a separate CIDR from the pod network and can be accessed from within the cluster as well on that IP.
The network overlay in Kubernetes is a pluggable component. Any provider that implements the Container Networking Interface APIs can be used as a network overlay, and these overlay providers can be chosen based on the features and performance required. In most environments, you will see overlay networks ranging from the cloud provider’s (such as Google Kubernetes Engine or Amazon Elastic Kubernetes) to operator-managed solutions such as flannel or Calico. Calico is a network policy engine that happens to include a network overlay. Alternatively, you can disable the built-in network overlay and use it to implement network policy on other overlays such as a cloud provider’s or flannel. This is used to enforce pod and service isolation, a requirement of most secure environments.
Troubleshooting Application Latency Issues
Now that we have a basic understanding of how networking works in Kubernetes, let’s look at an example scenario. We’ll focus on an example where a networking latency issue led to a network blockage. We’ll show you how to identify the cause of the problem and fix it.
To demonstrate this example, we’ll start by setting up a simple two-tier application representing a typical microservice stack. This gives us network traffic inside a Kubernetes cluster, so we can introduce issues with it that we can later debug and fix. It is made up of a web component and an API component that do not have any known bugs and correctly serve traffic.
These applications are written in the Go Programming Language and are using the AppOptics agent for Go. If you’re not familiar with Go, the “main” function is the entry point of our application and is at the bottom of our web tier’s file. It listens on the base path (“/”) and calls out to our API tier using the URL defined on line 13. The response from our API tier is written to an HTML template and displayed to the user. For brevity’s sake, error handling, middleware, and other good Go development practices are omitted from this snippet.
package main
 import (
          "context"
          "html/template"
          "io/ioutil"
          "log"
          "net/http"

          "github.com/appoptics/appoptics-apm-go/v1/ao"
)

const url = "http://apitier.default.svc.cluster.local"

func handler(w http.ResponseWriter, r *http.Request) {
      const tpl = `
<html>
  <head>
  <meta charset="UTF-8">
    <title>My Application</title>
  </head>
  <body>
    <h1>{{.Body}}</h1>
  </body>
</html>  `

      t, w, r := ao.TraceFromHTTPRequestResponse("webtier", w, r)
      defer t.End()
      ctx := ao.NewContext(context.Background(), t)

      httpClient := &http.Client{}
      httpReq, _ := http.NewRequest("GET", url, nil)

      l := ao.BeginHTTPClientSpan(ctx, httpReq)
      resp, err := httpClient.Do(httpReq)
      defer resp.Body.Close()
      l.AddHTTPResponse(resp, err)
      l.End()

      body, _ := ioutil.ReadAll(resp.Body)
      template, _ := template.New("homepage").Parse(tpl)

      data := struct {
              Body string
      }{
      Body: string(body),
      }

      template.Execute(w, data)
}

func main() {
      http.HandleFunc("/", ao.HTTPHandler(handler))
      http.ListenAndServe(":8800", nil)
}
Our API tier code is simple. Much like the web tier, it serves requests from the base path (“/”), but only returns a string of text. As part of this code, we propagate the context of any traces requested to this application with the name “apitier”. This sets our application up for end to end distributed tracing.
package main
import (
"context"
"fmt"
"net/http"
"time"
"github.com/appoptics/appoptics-apm-go/v1/ao"
)
func query() {
time.Sleep(2 * time.Millisecond)
}
func handler(w http.ResponseWriter, r *http.Request) {
t, w, r := ao.TraceFromHTTPRequestResponse("apitier", w, r)
defer t.End()
ctx := ao.NewContext(context.Background(), t)
parentSpan, _ := ao.BeginSpan(ctx, "api-handler")
defer parentSpan.End()
span := parentSpan.BeginSpan("fast-query")
query()
span.End()
fmt.Fprintf(w, "Hello, from the API tier!")
}
func main() {
http.HandleFunc("/", ao.HTTPHandler(handler))
http.ListenAndServe(":8801", nil)
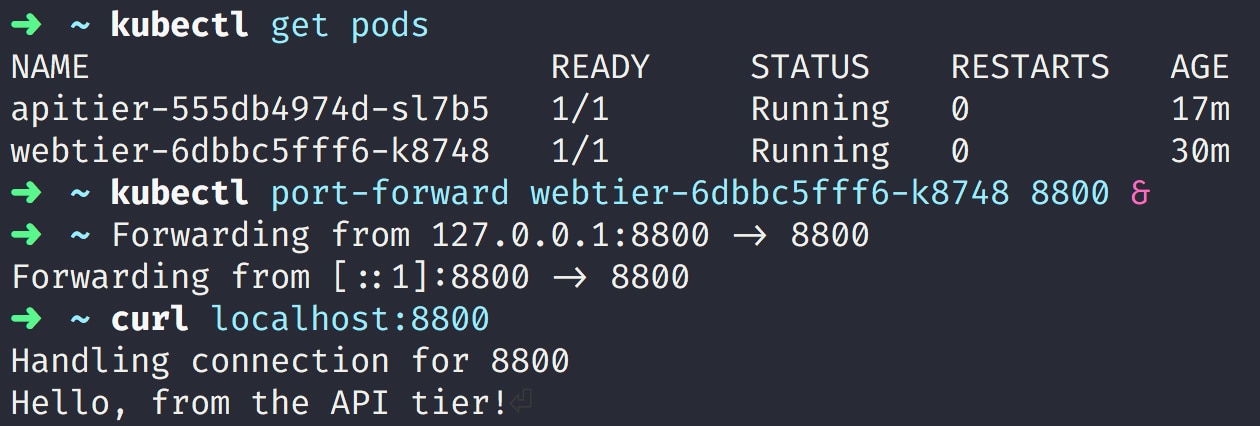
}When deployed on Kubernetes and accessed from the command line, these services look like this:
Copyright: Kubernetes
This application is being served a steady stream of traffic. Because the AppOptics APM agent is turned on and tracing is being used, we can see a breakdown of these requests and the time spent in each component, including distributed services. From the web tier component’s APM page, we can see the following graph:
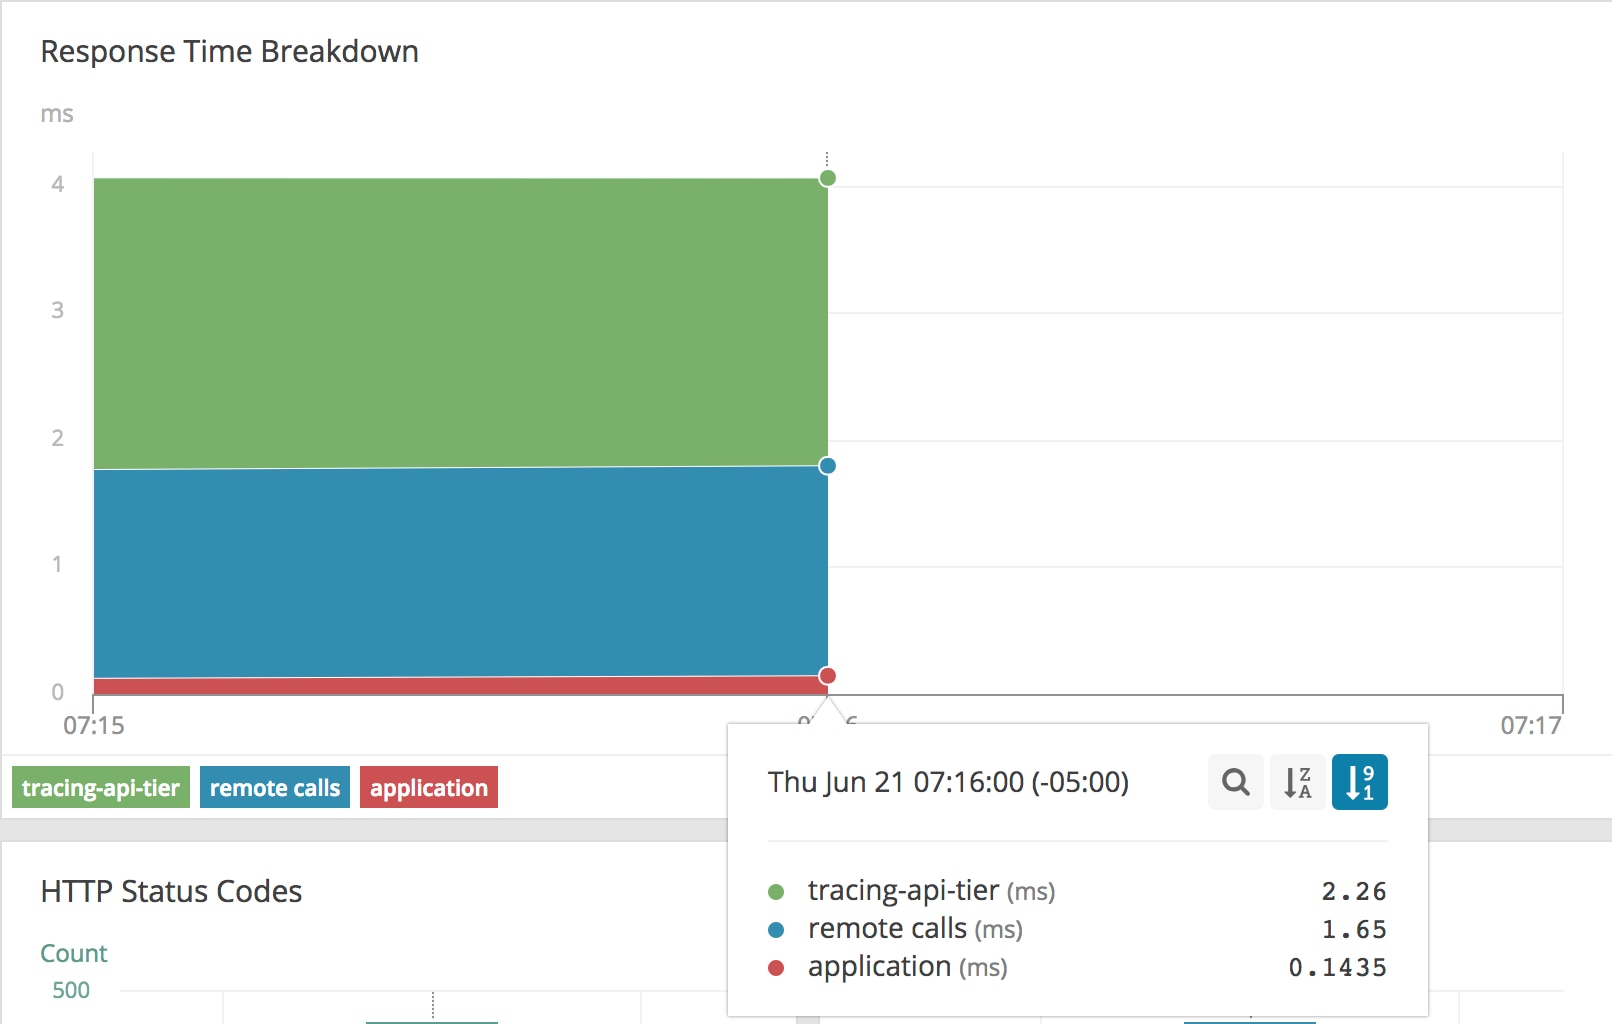
This view is telling us the majority of our time is spent in our API tier, with a brief amount of time spent in the web tier serving this traffic. However, we have an extra “remote calls” section. This section represents untraced time between the API tier and web tier. For a Kubernetes cluster, this includes our kube-proxy, network overlay, or proxies that have not had tracing added to them. This makes up 1.65ms of our request for a normal request, which for this environment adds an insignificant overhead, so we can use this as our “healthy” benchmark for this cluster.
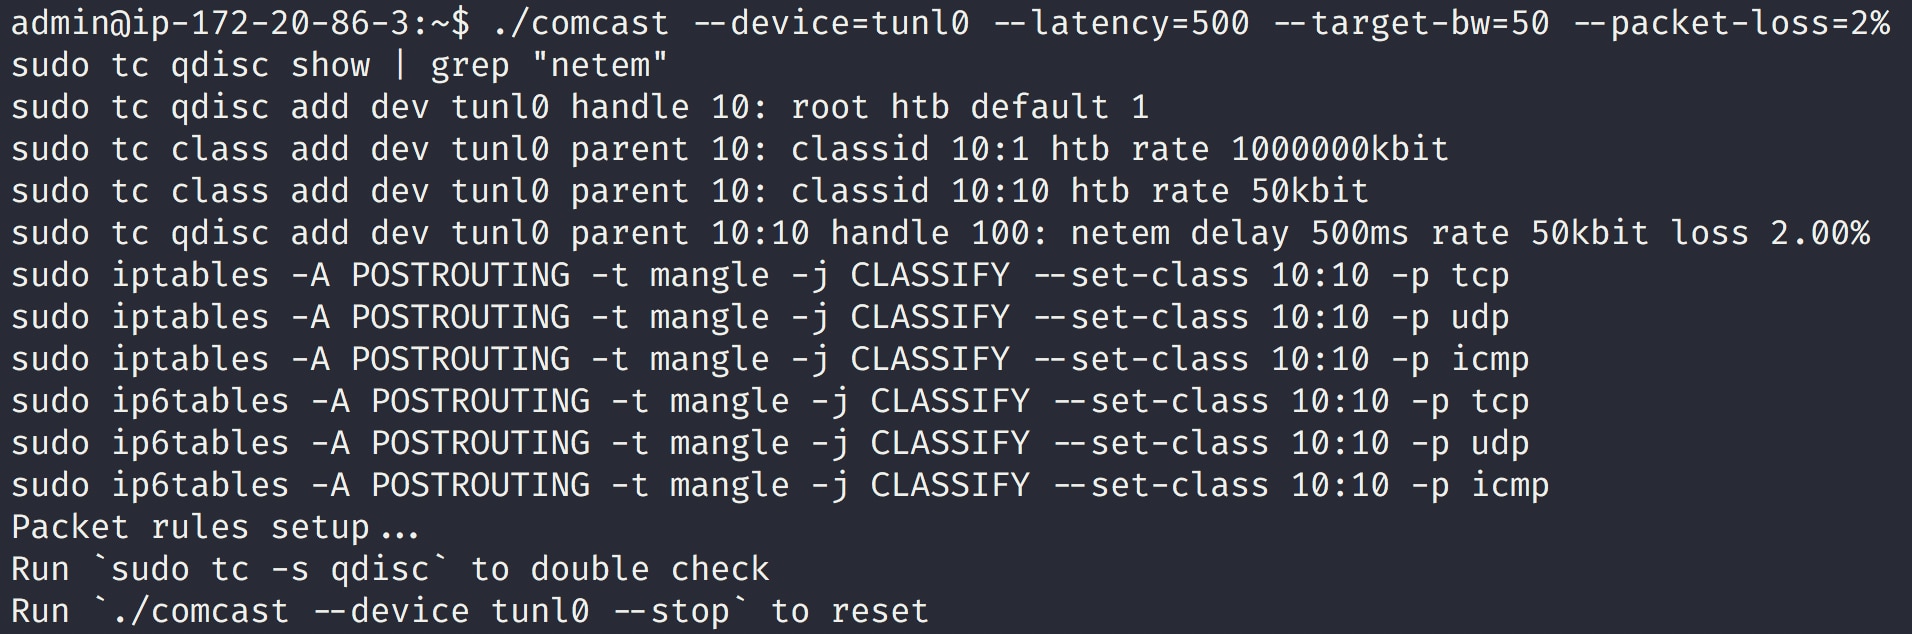
Now we will simulate a failure in the networking overlay layer. Using a tool satirically named Comcast, we can simulate adverse network conditions. This tool uses iptables and the traffic control (tc) utility, standard Linux utilities for managing network environments, under the hood. Our test cluster is using Calico as the network overlay and exposes a tunl0 interface. This is a custom, local tunnel Calico uses to bridge all network traffic to both implement the network overlay between machines and enforce policy. We only want to simulate a failure at the network overlay, so we use it as the device, and inject 500ms of latency with a maximum bandwidth of 50kbps and minor packet loss.
Our continuous traffic testing is still running. After a few minutes of new requests, our AppOptics APM graph looks very different:
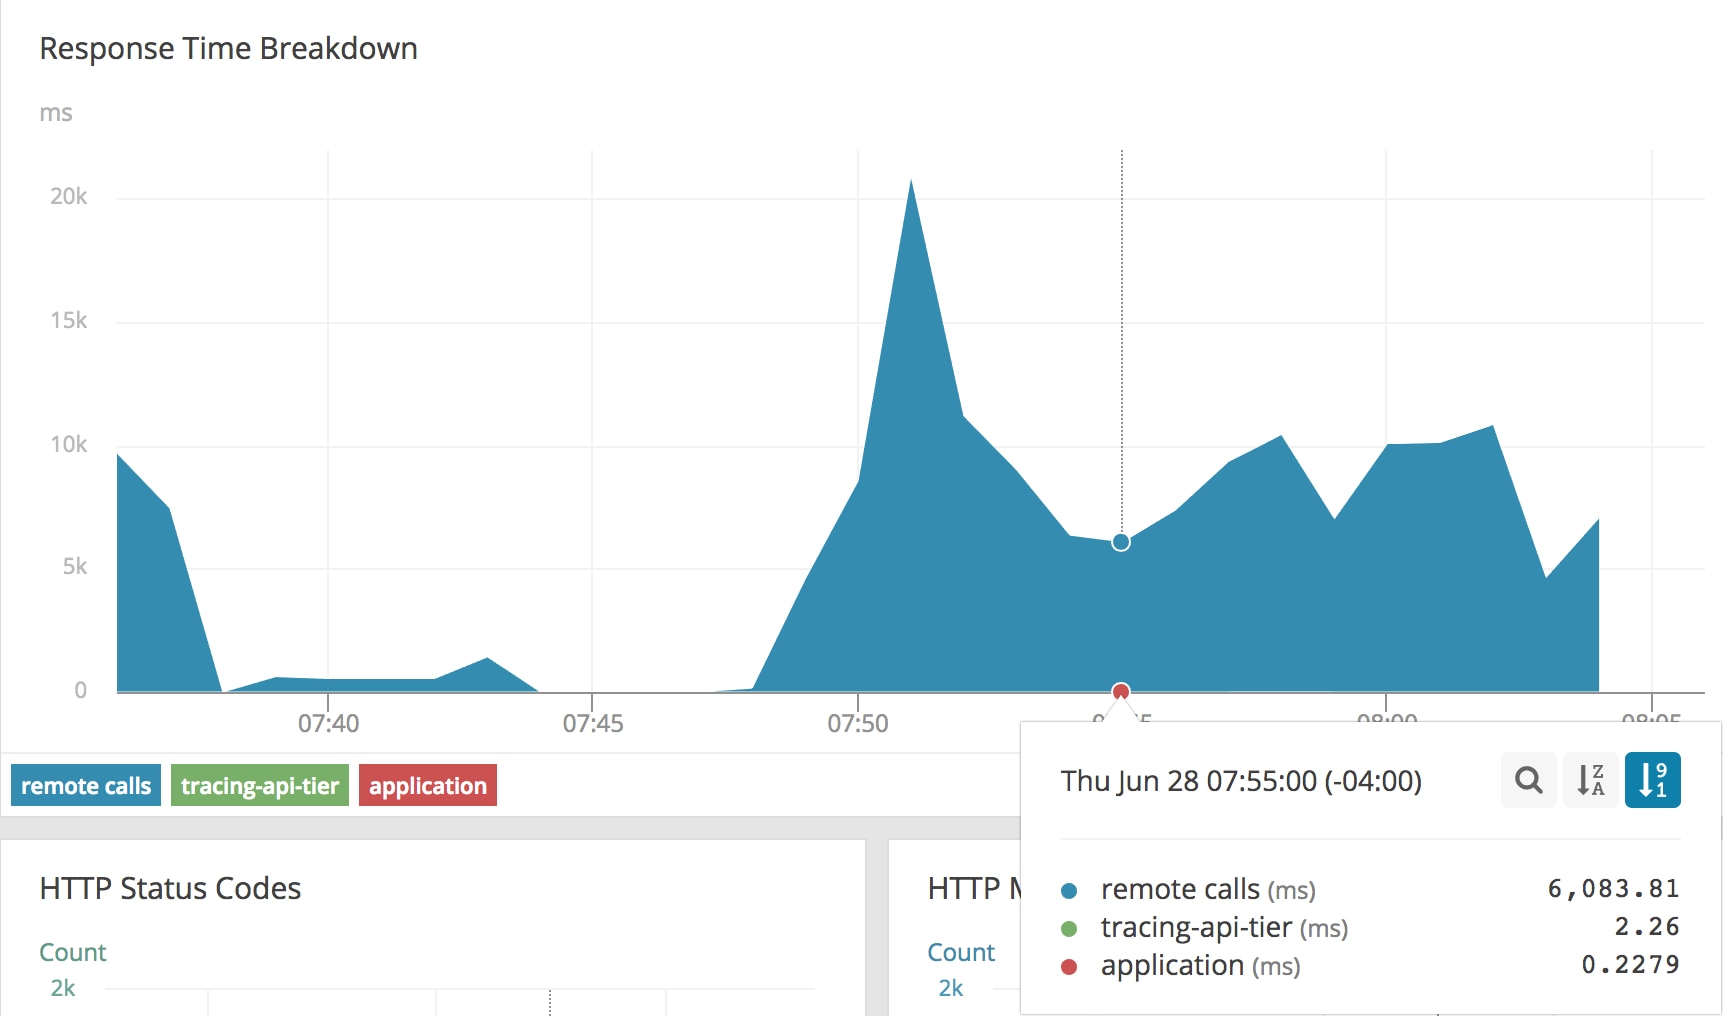
While our application time and tracing-api-tier remained consistent, our remote calls time jumped significantly. We’re now spending 6-20 seconds of our request time just traversing the network stack. Thanks to tracing, it’s clear that this application is operating as expected and the problem is in another part of our stack. We also have the AppOptics Agent for Kubernetes and Integration of CloudWatch running on this cluster, so we can look at the host metrics to find more symptoms of the problem:
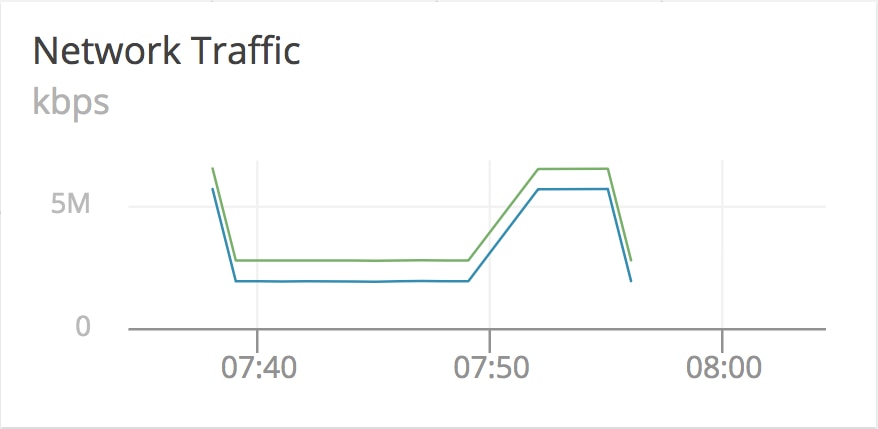
Our network graph suddenly starts reporting much more traffic, and then stops reporting entirely. This could be a symptom of our network stack handling a great deal of requests into our host on the standard interface (eth0), queueing at the Calico tunnel, and then overflowing and preventing any more network traffic from accessing the machine until existing requests time out. This aggregate view of all traffic moving inside of our host is deceptive since it’s counting every byte passing through internal as well as external interfaces, which explains our extra traffic.
We still have the problem where the agent stops reporting. Because the default pods use the network overlay, the agent reporting back to AppOptics suffers from the same problem our API tier is having. As part of recovering this application and helping prevent this issue from happening again, we would move the AppOptics agent off of the network overlay and use the host network.
Even with our host agent either delayed or not reporting at all, we still have the AppOptics CloudWatch metrics for this host turned on, and can get the AWS view of the networking stack on this machine:
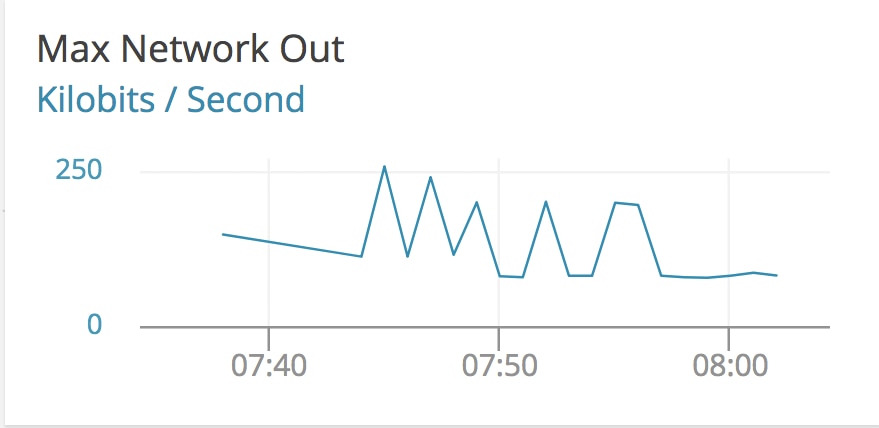
In this graph we see that at the start of the event traffic becomes choppy, but is generally fixed between 50Kb/s out on normal operation all the way up to 250Kb/s. This could be our bandwidth limits and packet loss settings causing bursts of traffic out. In any case, there’s a massive discrepancy between the networking inside of our Kubernetes cluster and outside of it, which points us to problems with our overlay stack. From here, we would move the node out of service, let Kubernetes automatically schedule our workloads onto other hosts, and proceed with host-level network debugging, like looking at our iptables settings, checking flow logs, and the health of our overlay components.
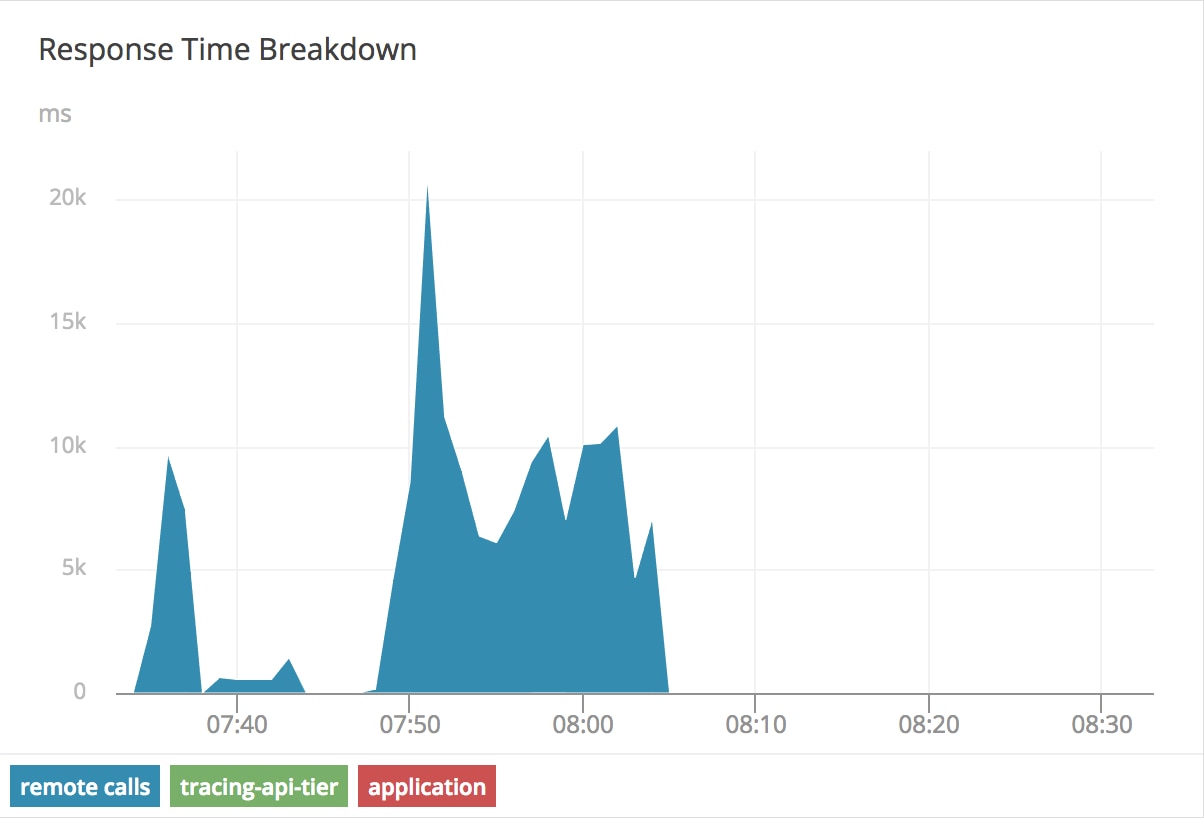
Once we remove these rules to clear the network issue, and our traffic quickly returns to normal.
The latency drops to such a small value, and it’s no longer visible on the graph after 8:05:
Next Steps
Hopefully now you are much more familiar with how the networking stack works on Kubernetes and how to identify problems. A monitoring solution like AppOptics APM can help you monitor the availability of service and troubleshoot problems faster. A small amount of tracing in your application goes a long way in identifying components of your systems that are having latency issues.