
How to Monitor NGINX Web Server Performance

When development started on NGINX in 2002, the goal was to develop a web server which would be more performant than Apache had been up to that point. While NGINX may not offer all of the features available in Apache, its default configuration can handle approximately four times the number of requests per second while using significantly less memory.
While switching to a web server with better performance seems like a no-brainer, it’s important that you have a monitoring solution in place to ensure that your web server is performing optimally, and that users who are visiting the NGINX-hosted site receive the best possible experience. But how do we ensure that the experience is as performant as expected for all users?
Monitoring!
This article is meant to assist you in putting together a monitoring plan for your NGINX deployments. We’ll look at what metrics you should be monitoring, why they are important, and putting a monitoring plan in place using SolarWinds AppOptics
 .
.
Monitoring is a Priority
As engineers, we all understand and appreciate the value that monitoring provides. In the age of DevOps, however, when engineers are responsible for both the engineering and deployment of solutions into a production environment, monitoring is often relegated to the list of things we plan to do in the future. In order to be the best engineers we can be, monitoring should be the priority from day one.
Accurate and effective monitoring allows us to test the efficiency of our solutions, and help identify and troubleshoot inefficiencies and other potential problems. Once the solution has moved to requiring operational support, monitoring allows us to ensure that the application is running efficiently and alerting us when things go wrong. An effective monitoring plan should help to identify problems before they start, allowing engineers to resolve issues proactively, instead of being purely reactive.
Specific Metrics to Consider with NGINX
Before we can develop a monitoring plan, we need to know what metrics are available for monitoring, understand what they mean, and how we can use them. There are two distinct groups of metrics we should be concerned with—metrics related to the web server itself, and those related to the underlying infrastructure.
While a highly performant web server like NGINX may be able to handle more requests and traffic, it is vital that the machine hosting the web server has the necessary resources as well. Each metric represents a potential limit to the performance of your application. Ultimately, you want to ensure your web server and underlying infrastructure are able to operate efficiently without approaching those limits.
NGINX Web Server-specific Metrics
- Current Connections
Indicates the number of active and waiting client connections with the server. This may include actual users and automated tasks or bots. - Current Requests
Each connection may be making one or more requests to the server. This number indicates the total count of requests coming in. - Connections Processed
This shows the number of connections that have been accepted and handled by the server. Dropped connections can also be monitored.
Infrastructure-specific Metrics
- CPU Usage
An indication of the processing usage of the underlying machine. This should be measured as utilization across all cores, if using a multi-core machine. - Memory Usage
Measurement of the memory currently in use on the machine. - Swap Usage
Swap is what the host machine uses when it runs out of memory or if the memory region has been unused for a period of time. It is significantly slower, and is generally only used in an emergency. When an application begins using swap space, it’s usually an indicator that something is amiss. - Network Bandwidth
Similar to traffic, this is a measurement of information flowing in and out of the machine. Again, load units are important to monitor here as well. - Disk Usage
Even if the web server is not physically storing files on the host machine, space is required for logging, temporary files, and other supporting files. - Load
Load is a performance metric which combines many of the other metrics into a simple number. A common rule of thumb is the load on the machine should be less than the number of processing cores.
Let’s look at how to configure monitoring on your instances with AppOptics, along with building a dashboard which will show each of those metrics.
Installing the AppOptics Agent on the Server
Before you start, you’ll need an account with AppOptics. If you don’t already have one, you can create a demo account, which will give you 14 days to try the service, free of charge.
The first thing to do to allow AppOptics to aggregate the metrics from the server is install the agent on all instances. To do this, you’ll need to reference your AppOptics API token when setting up the agent. Log in to your AppOptics account and navigate to the Infrastructure page.
Locate the Add Host button, and click on it. It should look similar to the image below.
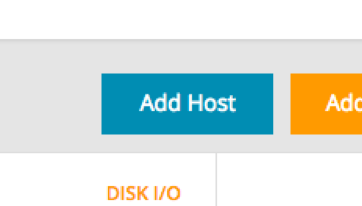
Fig. 2. AppOptics Host Agent Installation
I used the Easy Install option when setting up the instances for this article. Ensure that Easy Install is selected, and select your Linux distribution. I used an Ubuntu image in the AWS Cloud, but this will work on almost any Linux server.
Note: Prior to installation of the agent, the bottom of the dialog below will not contain the success message.
Copy the command from the first box, and then SSH into the server and run the Easy Install script.
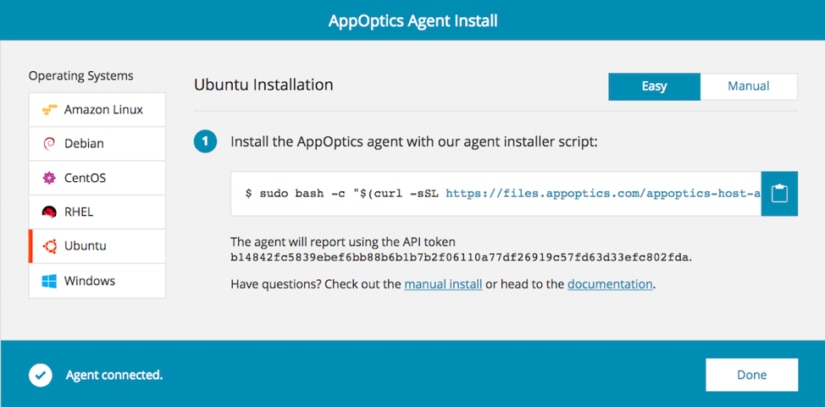
Fig. 3. Easy Install Script to Add AppOptics Agent to a Server
When the agent installs successfully, you should be presented with the following message on your terminal. The “Confirm successful installation” box on the AppOptics agent screen should look similar to the above, with a white on blue checkbox. You should also see “Agent connected.”
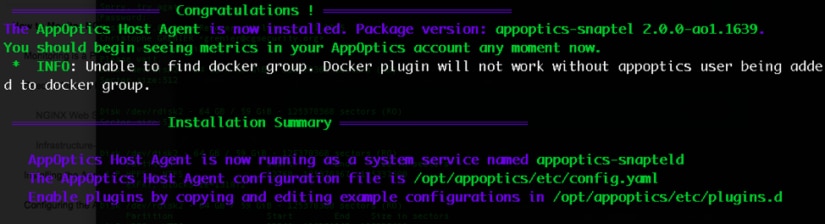
Fig. 4. Installing the AppOptics Agent on your NGINX Instance
Configuring the AppOptics Agent
With the agent installed, the next step is to configure NGINX to report metrics to the agent. Navigate back to the Infrastructure page, Integrations tab, and locate the NGINX plugin.
Note: Prior to enabling the integration, the “enabled” checkbox won’t be marked.
Fig. 5. NGINX Host Agent Plugin
Click on the plugin, and the following panel will appear. Follow the instructions in the panel, click Enable Plugin, and your metrics will start flowing from the server into AppOptics.
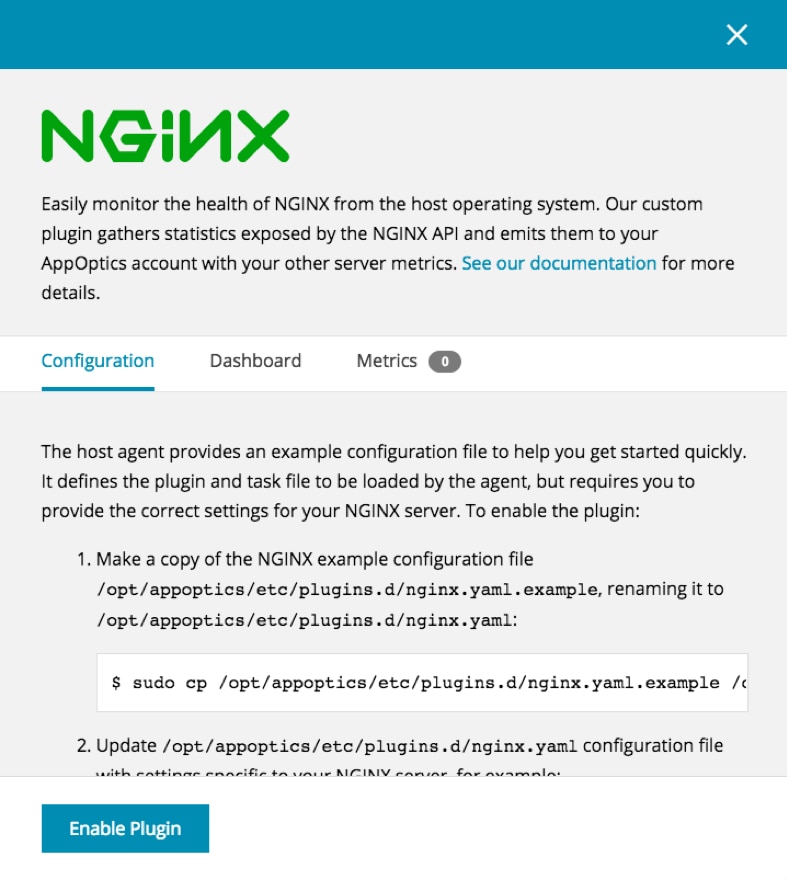
Fig. 6. NGINX Plugin Setup
When everything is configured, either click on the NGINX link in the panel’s Dashboard tab, or navigate to the Dashboards page directly, then select the NGINX link to view the default dashboard provided by AppOptics.
Working With the NGINX Dashboard
The default NGINX dashboard provided by AppOptics offers many metrics related to the performance of the web server that we discussed earlier and should look similar to the image below.
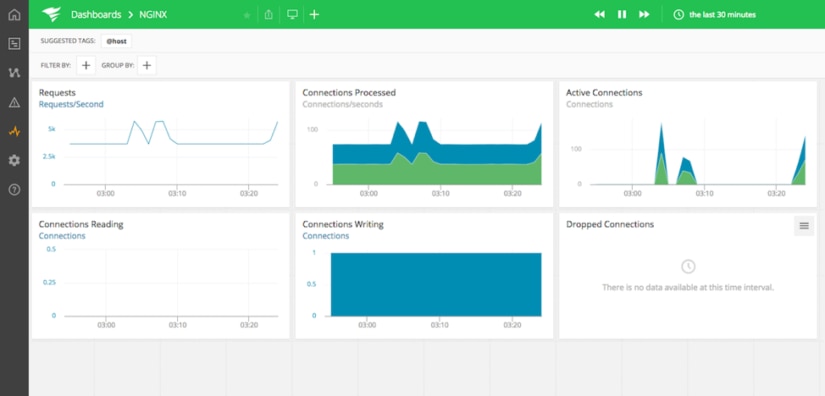
Fig. 8. Default AppOptics Dashboard
Now we need to add some additional metrics to get a full picture of the performance of our server. Unfortunately, you can’t make changes to the default dashboard, but it’s easy to create a copy and add metrics of your own. Start by clicking the Copy Dashboard button at the top of the screen to create a copy.
Create a name for your custom dashboard. For this example, I’m monitoring an application called Retwis, so I’m calling mine “NGNIX-Retwis.” It’s also helpful to select the “Open dashboard on completion” option, so you don’t have to go looking for the dashboard after it’s created.
Let’s do some customization. First, we want to ensure that we’re only monitoring the instances we need to. We do this by filtering the chart or dashboard. You can find out more about how to set and filter these in the documentation for Dynamic Tags.
With our sources filtered, we can add some additional metrics. Let’s look at CPU Usage, Memory Usage, and Load. Click on the Plus button located at the bottom right of the dashboard. For CPU and Memory Usage, let’s add a Stacked chart. We’ll add one for each. Click on the Stacked icon.

Fig. 10. Create New Chart
In the Metrics search box, type “CPU” and hit enter. A selection of available metrics will appear below. I’m going to select system.cpu.utilization, but your selection may be different depending on the infrastructure you’re using. Select the checkbox next to the appropriate metric, then click Add Metrics to Chart. You can add multiple metrics to the chart by repeating the same process, but we’ll stick with one for now.
If you click on Chart Attributes, you can change the scale of the chart, adjust the Y-axis label, and even link it to another dashboard to show more detail for a specific metric. When you’re done, click on the green Save button, and you’ll be returned to your dashboard, with the new chart added. Repeat this for Memory Usage. I chose the “system.mem.used” metric.
For load, I’m going to use a Big Number Chart Type, and select the system.load.1_rel metric. When you’re done, your chart should look similar to what is shown below.
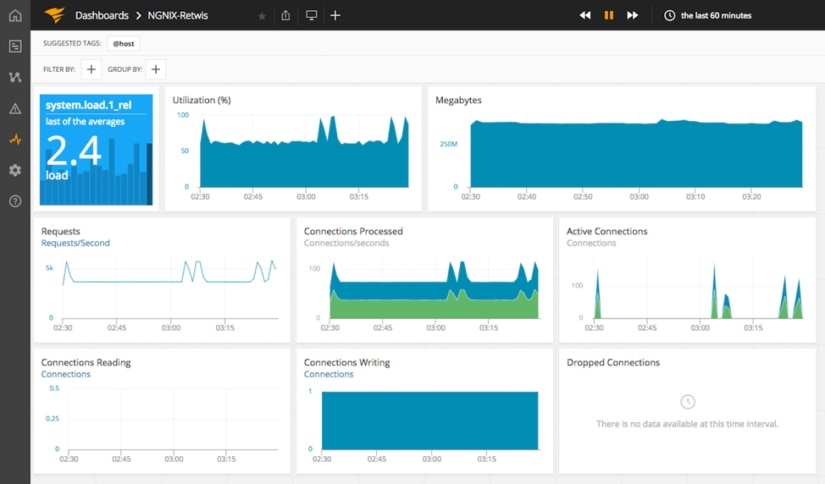
Fig. 11. Custom Dashboard to View NGINX Metrics
Pro tip: You can move charts around by hovering over a chart, clicking on the three dots that appear at the top of the chart, and dragging it around. Clicking on the menu icon on the top right of the chart will allow you to edit, delete, and choose other options related to the chart.
Beyond Monitoring
Once you have a monitoring plan in place and functioning, the next step is to determine baseline metrics for your application and set up alerts which will be triggered when significant deviations occur. Traffic is a useful baseline to determine and monitor. A significant reduction in traffic may indicate a problem that is preventing clients from accessing the service. A significant increase in traffic would indicate an increase in clients, and may require either an increase in the capacity of your environment (in the case of increased popularity), or, potentially, the deployment of defensive measures in response to a cyberattack.
Monitoring your NGINX server is critical as a customer-facing part of your infrastructure. You need to know immediately when there is a sudden change in traffic or connections that could impact the rest of your application or website. AppOptics provides an easy way to monitor your NGINX servers and it typically only takes a few minutes to get started. Learn more about AppOptics infrastructure monitoring and try it today with a free 14-day trial.